Fig. 4.
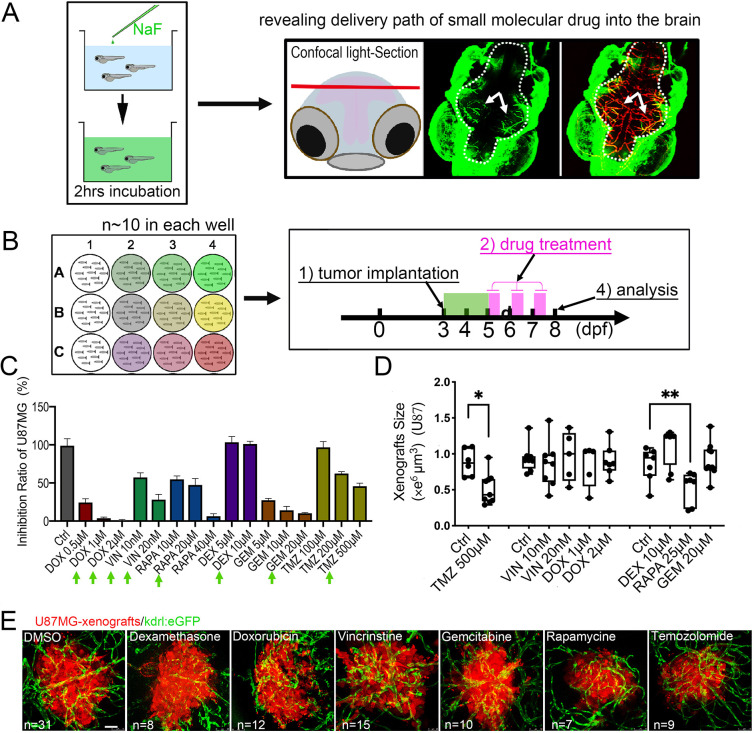
Zebrafish GBM xenografts enable identification of BBB-penetrating drugs with in vivo activity on the tested GBM. (A) Schematic showing the small-molecule chemical delivery path into the zebrafish brain (5 dpf) from culturing water. NaF (10 μM) was added directly to fish water 2 h before imaging. Within the brain, NaF was restricted to cerebral vessels (arrows), but not freely diffusing in the parenchyma. (B) Schematic showing the strategy of grouping and drug treatment using the zebrafish GBM xenografts (U87MG). (C) Graph showing the growth inhibition of U87MG in vitro after 3 days’ treatment by various drugs at different concentrations. Cell number was tested by MTT assay, and the concentrations further tested in vivo were marked. (D) Box and whisker plot showing the xenograft size in each group after the drug treatment, showing significant inhibition by TMZ and RAPA. Median (minimum and maximum) values are 0.8725 (0.67-1.1), 0.43 (0.29-0.95), 0.91 (0.719-1.36), 0.8765 (0.415-1.465), 1 (0.532-1.365), 1.032 (0.385-1.045), 0.865 (0.618-1.308), 0.945 (0.413-1.083), 1.247 (0.639-1.298), 0.624 (0.2116-0.731) and 0.816 (0.531-1.381) for control, TMZ 500 μM, control, VIN 10 nM, VIN 20 nM, DOX 1 μM, DOX 2 μM, control, DEC 10 μM, RAPA 25 μM and GEM 20 μM, respectively. (E) Representative images of intracranial xenografts (U87MG) after drug treatment. The numbers of evaluated samples are indicated. Scale bars: 50 µm. Ctrl, control; RAPA, rapamycin; TMZ, temozolomide; VIN, vincristine.

