Fig. 5.
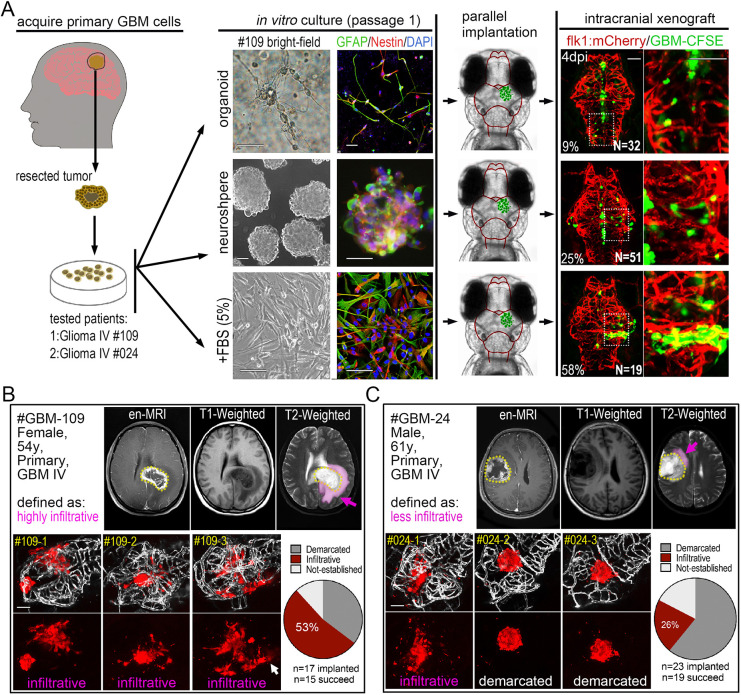
Orthotopic engraftment of patient-derived GBM cells into the zebrafish brain. (A) Left: schematic showing the acquisition of primary GBM cells from patients. Middle: bright-field and fluorescent microscopy of in vitro cultured primary GBM cells (passage 1) from the same patient as 3D organoid, neurosphere and attached single-layer cells. Immunofluorescence staining showing NES and GFAP expression in differently cultured primary GBM cells. Right: fluorescence microscopy of 4 dpi GBM xenografts from primary GBM cells (passage 1). Primary GBM cells were labeled with CFSE before injecting into zebrafish brain. Two patients (GBM#109 Grade IV and GBM#24 Grade IV) were tested. (B,C) Fluorescence microscopy of 4 dpi patient-derived GBM xenografts from GBM patients (GBM#109, B; GBM#24, C), showing the heterogeneous phenotypes (infiltrative or demarcated) of primary GBM xenografts. Top: #GBM109 was defined as highly infiltrative and #GMB24 was defined as less infiltrative by MRI. Pink labeling (pink arrows) in MRI images indicates the edema zone and potential infiltrating areas. Bottom: brain vasculature is highlighted by fake gray color (kdrl:eGFP). Xenografts with more than five individual infiltrating cell clusters (white arrow) were defined as infiltrative, otherwise they were defined as demarcated. The numbers of xenografts with different phenotypes were counted (pie charts). Scale bars: 100 µm.

