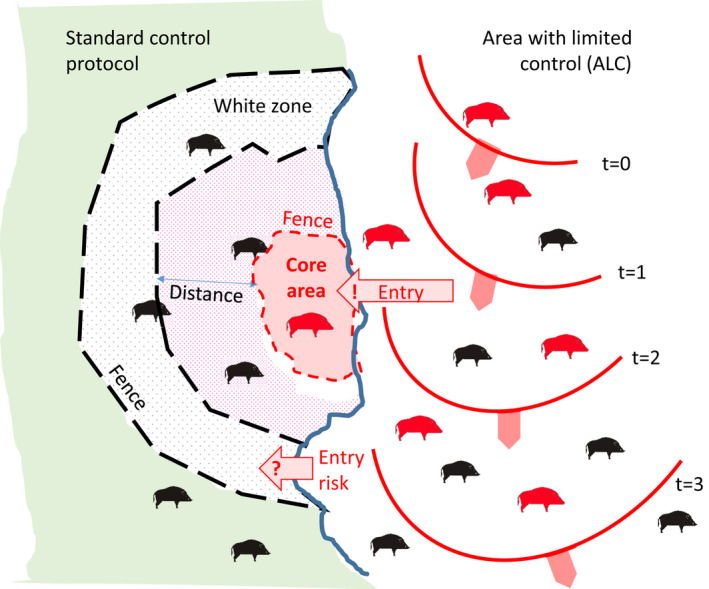
Figure 3.

- The wild boar habitat is separated into an area with less intensive control measures, and an area with intensive control measures. The separation line between the two areas (bold blue line) symbolises the presence of a certain demarcation (e.g. a fence). Red animals symbolise infection and the red waves the advance of the epidemic over time. In the scenario, mobile or fixed fences (black dashed lines) are set up as a response to an ASF intrusion in the wild boar habitat.
