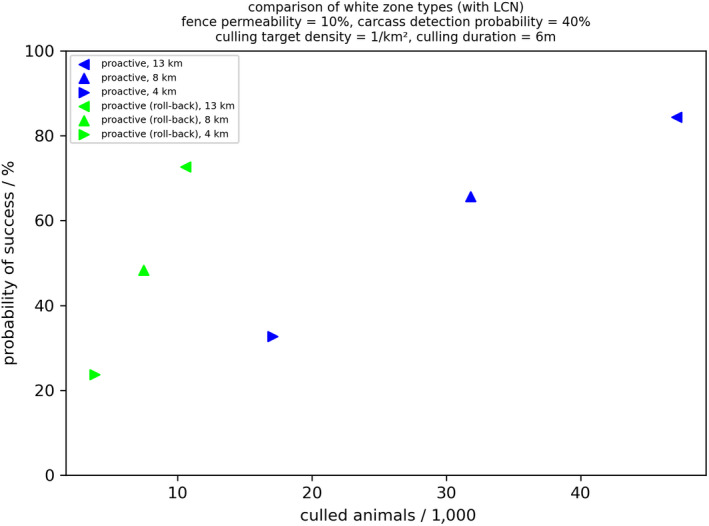
Figure 65.

Overview of model output comparing the overall success achieved when simulating the proactive white zone (blue triangles) and the proactive white zone + roll‐back (green triangles). Triangle format represents the width of the white zone (i.e. 13, 8 and 4 km)
