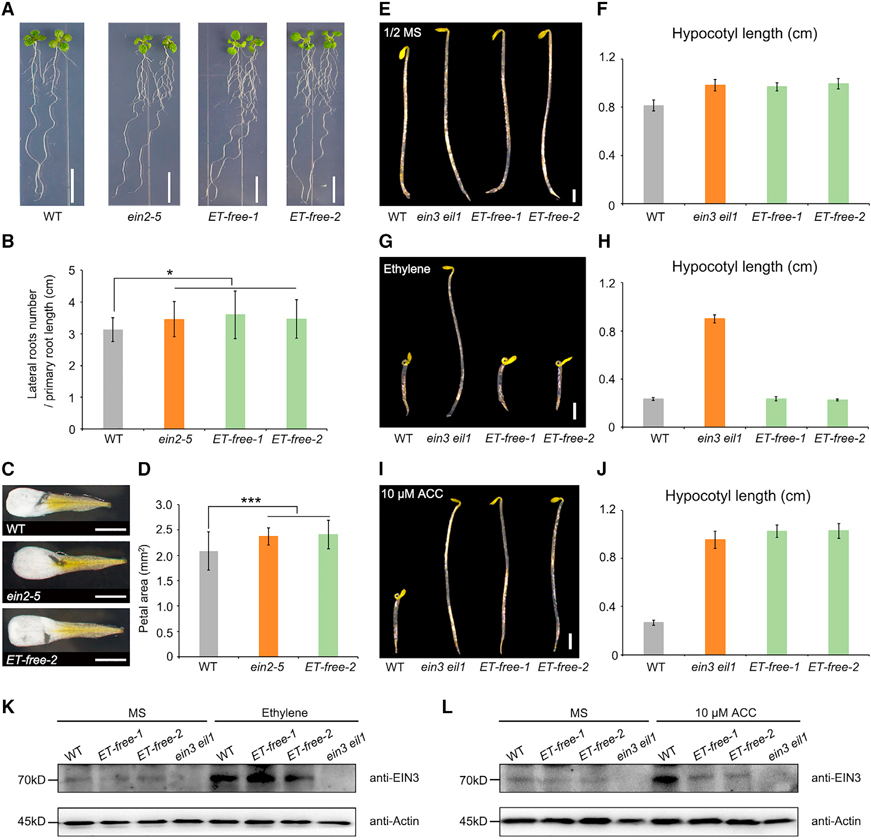
Figure 2. ET-free mutants shows that ethylene but not its precursor ACC is responsible for the triple response.
(A and B) Representative images and statistical analysis of lateral root density (number of lateral roots/primary root length [cm]) in WT (n = 22), ein2–5 (n = 22), and ET-free mutants (ET-free-1, n = 20; ET-free-2, n = 20).
(C and D) Representative images and statistical analysis of petal area in WT (n = 67), ein2–5 (n = 78), and ET-free mutants (n = 61). Scale bars, 1 cm.
(E–J) Triple response of WT, ein3 eil1, and ET-free mutants. (E and F) Seedlings grown on 1/2MS medium, and statistical analysis of hypocotyl length. (G and H) Seedlings grown on 1/2MS medium with 10 ppm ethylene treatment in darkness for 4 days, and statistical analysis of hypocotyl length. (I and J) Seedlings grown on 1/2MS medium in darkness for 4 days treated with 10 μM ACC, and corresponding statistical analysis of hypocotyl length. Scale bars, 1 mm.
(K and L) Immunoblots showing endogenous EIN3 protein in seedlings grown on 1/2MS medium or 1/2MS medium with 10 ppm ethylene gas or 10 μM ACC treatment in darkness for 3 days. Anti-EIN3 and anti-Actin antibodies were used for immunoblots. Actin was used as a loading control.
Gray boxes indicate WT, orange boxes indicate the ein3 eil1 mutant, and green boxes indicate ET-free mutants, n = 15. Data are mean values ± SD. In (B) and (D), ***P < 0.01, *0.01 < P < 0.05; P values were >0.05 between ein2–5 and ET-free mutants (Student’s t-test). Scale bars, 1 mm.

