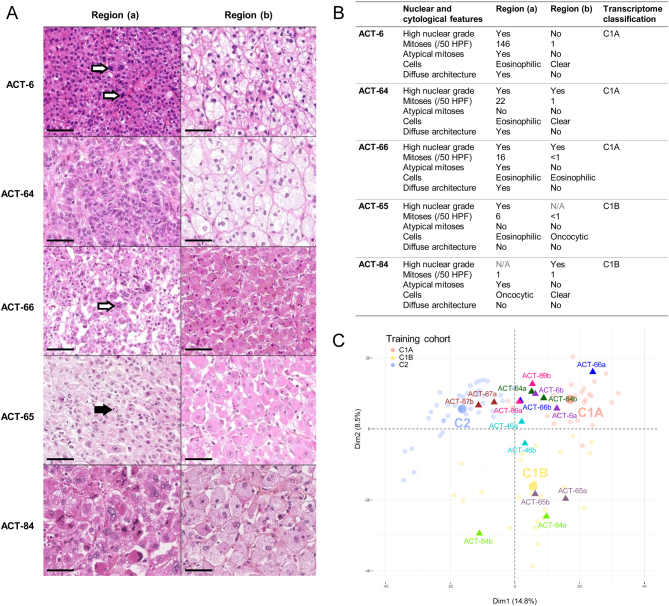
Figure 2.
FFPE transcriptome classification in different tumor regions. (A) Hematoxylin/eosin/safran staining (40× magnification) of the two different tumor regions sampled for five patients in the training cohort, with one aggressive (region a) and one less aggressive (region b) region. The black bar represents 50 µm. Black arrows indicate mitosis. White arrows indicate atypical mitoses. (B) Description of the two different tumor regions sampled for the five patients with one aggressive (-a) and one less aggressive (-b) region. N/A: Fuhrman nuclear grade is not applicable for oncocytic cells. (C) Samples projection based on the two principle components (Dim1 and Dim2) of the PCA performed based on the 2000 most variable genes in the 95 unique patients of the training cohort. Samples from the training cohort are presented as faint circles colored by transcriptome class. Samples from two different tumor regions for eight patients are presented as full triangles colored by patient.

 This work is licensed under a