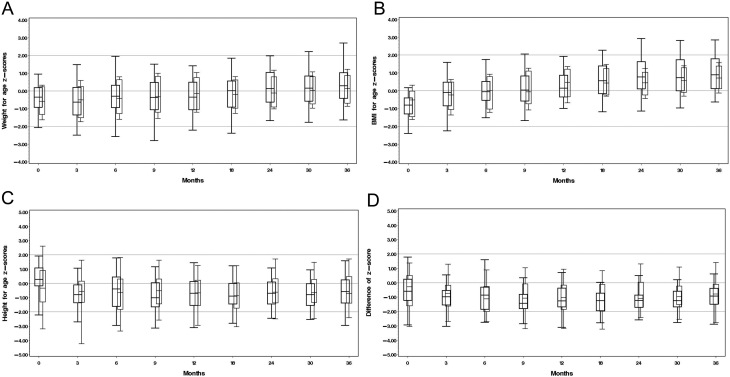
Figure 2.
Box plots of weight for age z-scores (A), BMI for age z-scores (B), height for age z-scores (C) and difference between height for age z-scores and parental target height z-scores (D) in ST and NST group from birth to 3 years of life. The bottom and top edges of the box are located at the sample 25th and 75th percentiles. The length of the whiskers is the 5th percentile low and 95th high. ST, children treated with salt at least between two time points between birth and 365 days of life (right-sided boxes); NST, children did not receive salt supplementation at any time point between birth and 365 days of life (left-sided boxes, bold).

 This work is licensed under a