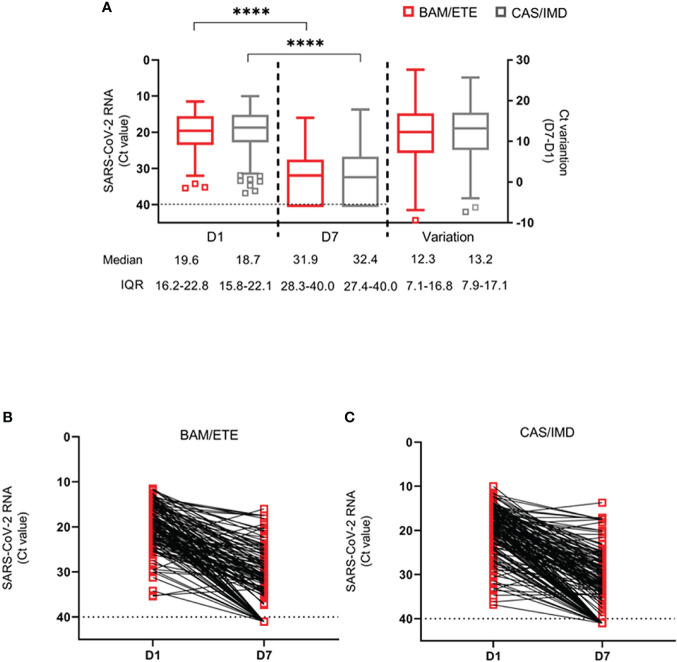
Figure 5.
SARS-CoV-2 RNA levels at D1 and D7 in patients treated with CAS/IMD and BAM/ETE. (A) Box-and-whiskers plot showing the comparison of viral loads detected at D1 and D7 in patients treated with BAM/ETE (n=170 and 154, respectively) or CAS/IMD (n=183 and 174, respectively), and the variation of RNA levels observed between the two time-points by intervention (BAM/ETE, n=145; CAS/IMD, n=165). Viral RNA levels are expressed as CT of Orf1ab gene amplification. Median CT values and IQR are shown. Statistical analysis of the comparisons between treatment groups was performed by Mann–Whitney test: D1, p=0.29; D7, p=0.87; and Variation, p=0.71. CT values at D1 and D7 within each group were compared using paired Wilcoxon sign-rank test, ****p<0.0001. (B, C) Spaghetti-plot showing the Orf1ab CT values measured at D1 and D7 in each patient treated with BAM/ETE (n= 145, B) or CAS/IMD (n=165, C). Horizontal dashed line represents the limit of detection (CT: 40.0), values ≥40 are considered negative.

