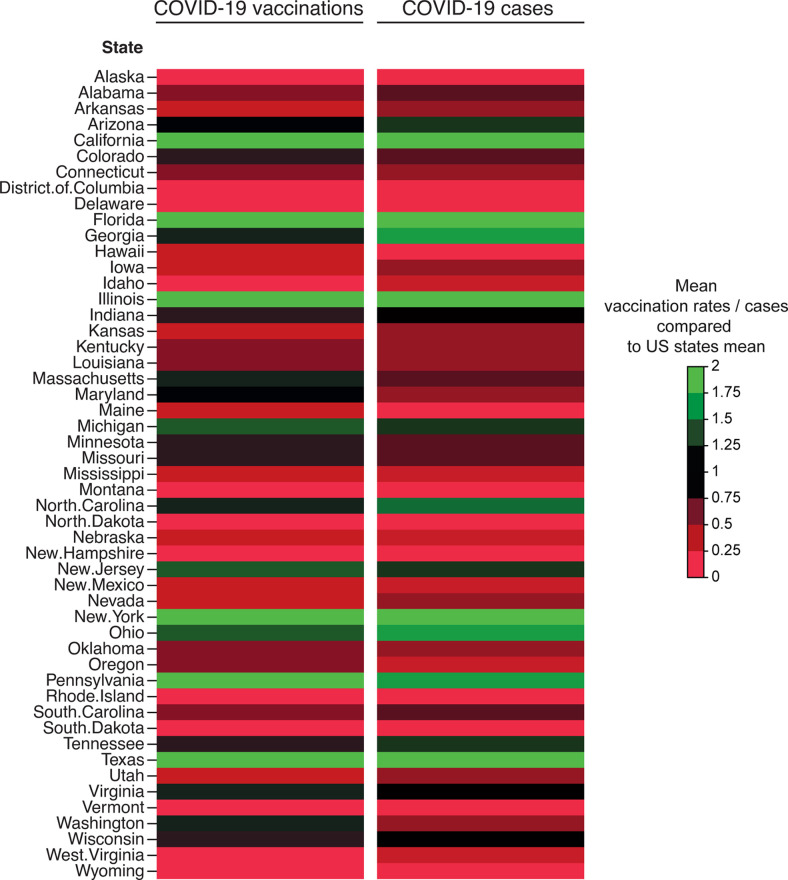
Figure 2.
COVID-19 vaccination rates and COVID-19 cases across 51 states in relation to US trends. Means of weekly COVID-19 vaccination rates across 51 between January 10, 2021, and May 31, 2021 are shown as a fraction of the US average. For COVID-19 mean daily cases between June 1, 2020 and May 31, 2021 are depicted as a fraction of US state average. Data are shown as color-coded heatmaps by US states as indicated by the legend (green to red).

