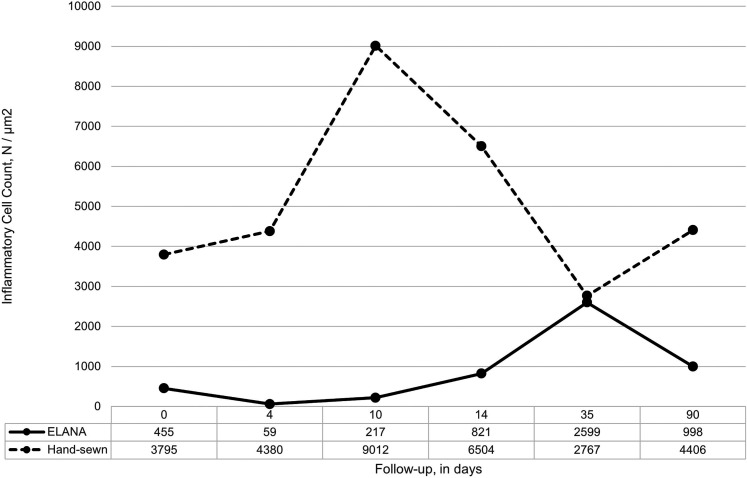
Fig. 5.
Inflammatory cell density at the end of follow-up. Count of well-defined nuclei in 6 predefined areas (24 fields) near the mid-anastomotic joining line in H&E stained slides (400× magnification). Measurements are depicted per follow-up term and represent n = 1 pig for the follow-up terms up to 35 days and a mean (n = 3 pigs) for the 90-day follow-up.

