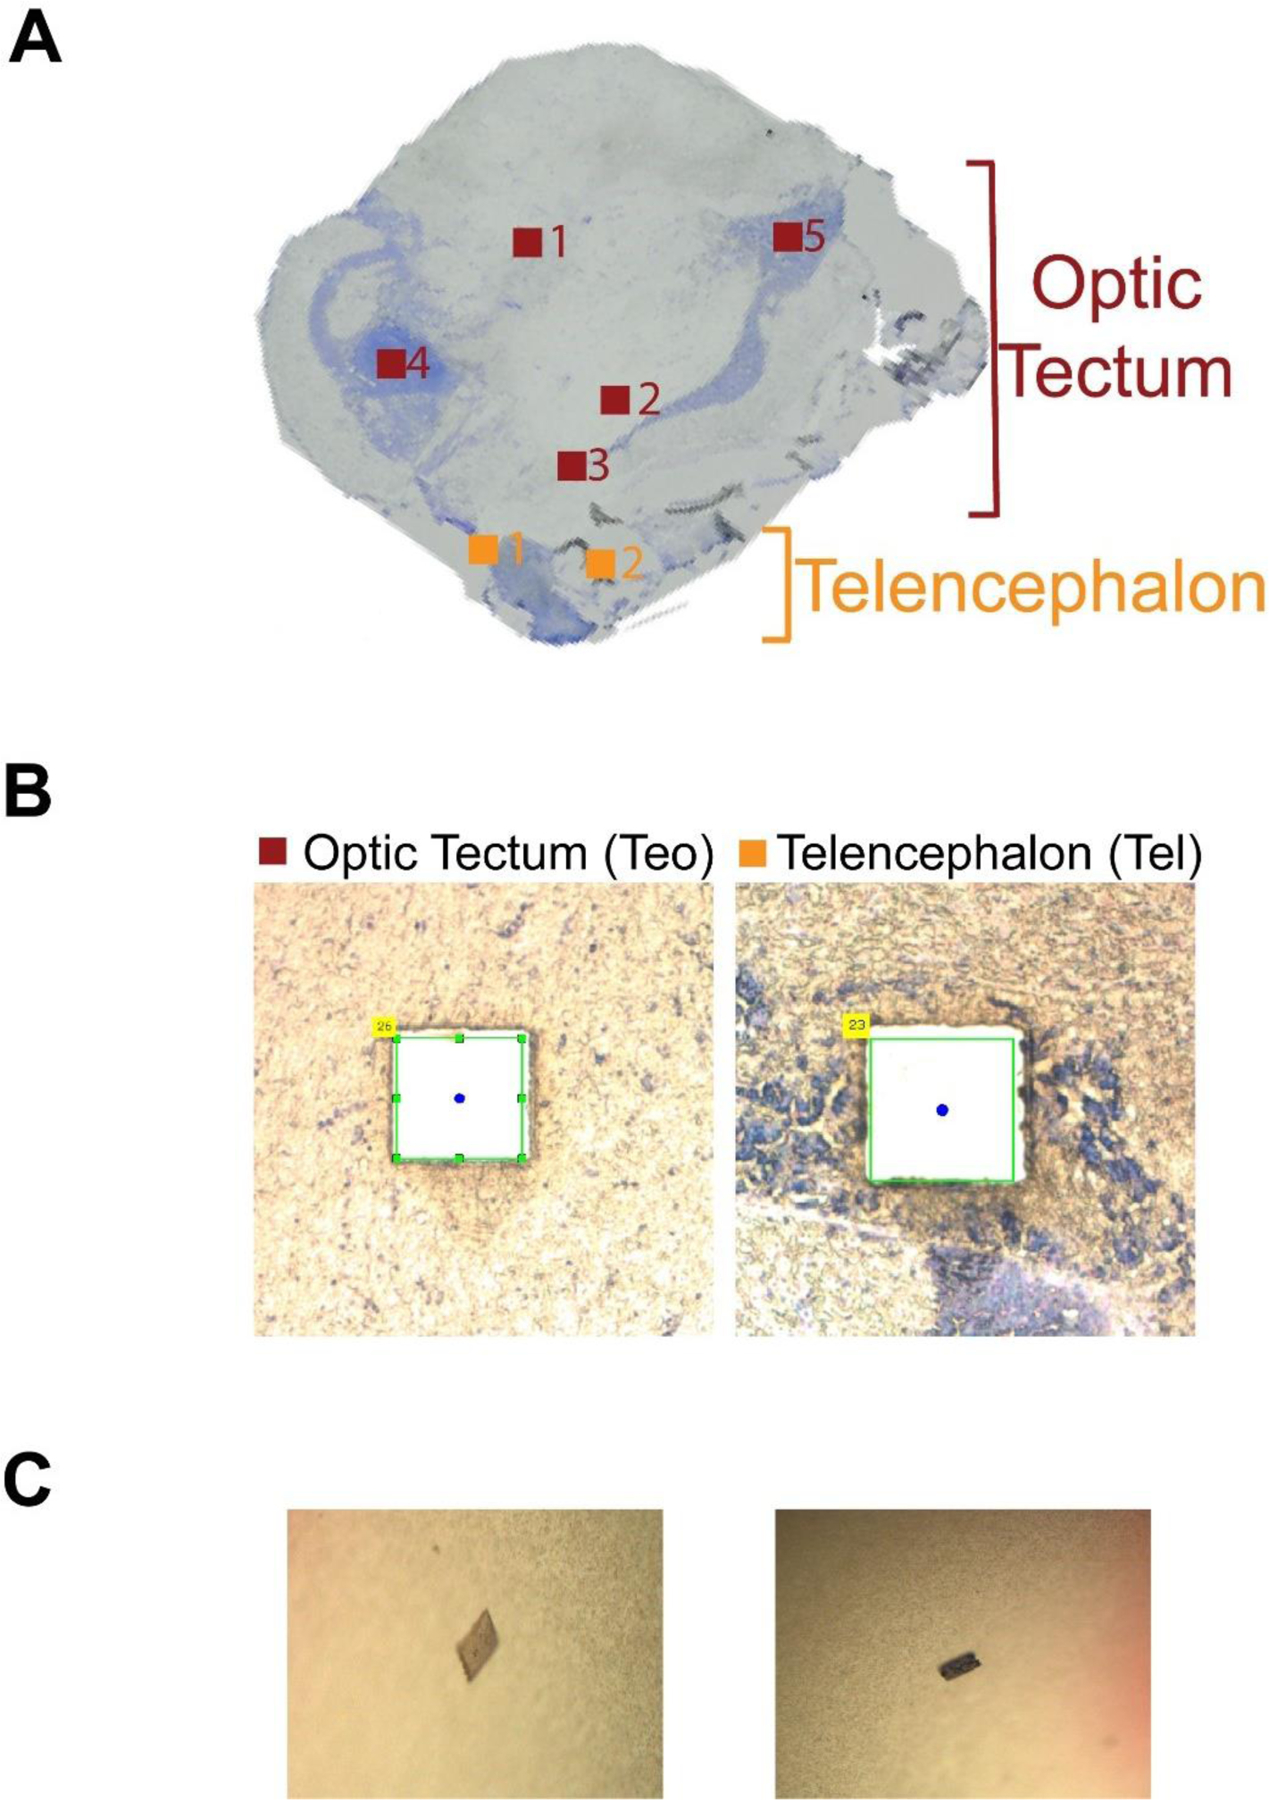
Fig. 2.

(A) An image of one 20 μm-thick zebrafish brain slice used in the study. The collected square regions of the zebrafish brain Optic Tectum (Teo) and Telencephalon (Tel) are highlighted. Each region has an area of 500 μm2. (B) The microscopic images of two square regions of Teo and Tel after the microdissection. (C) The corresponding tissue sections collected in (B) on the caps of Eppendorf tubes that were used for sample collection in the LCM experiment.
