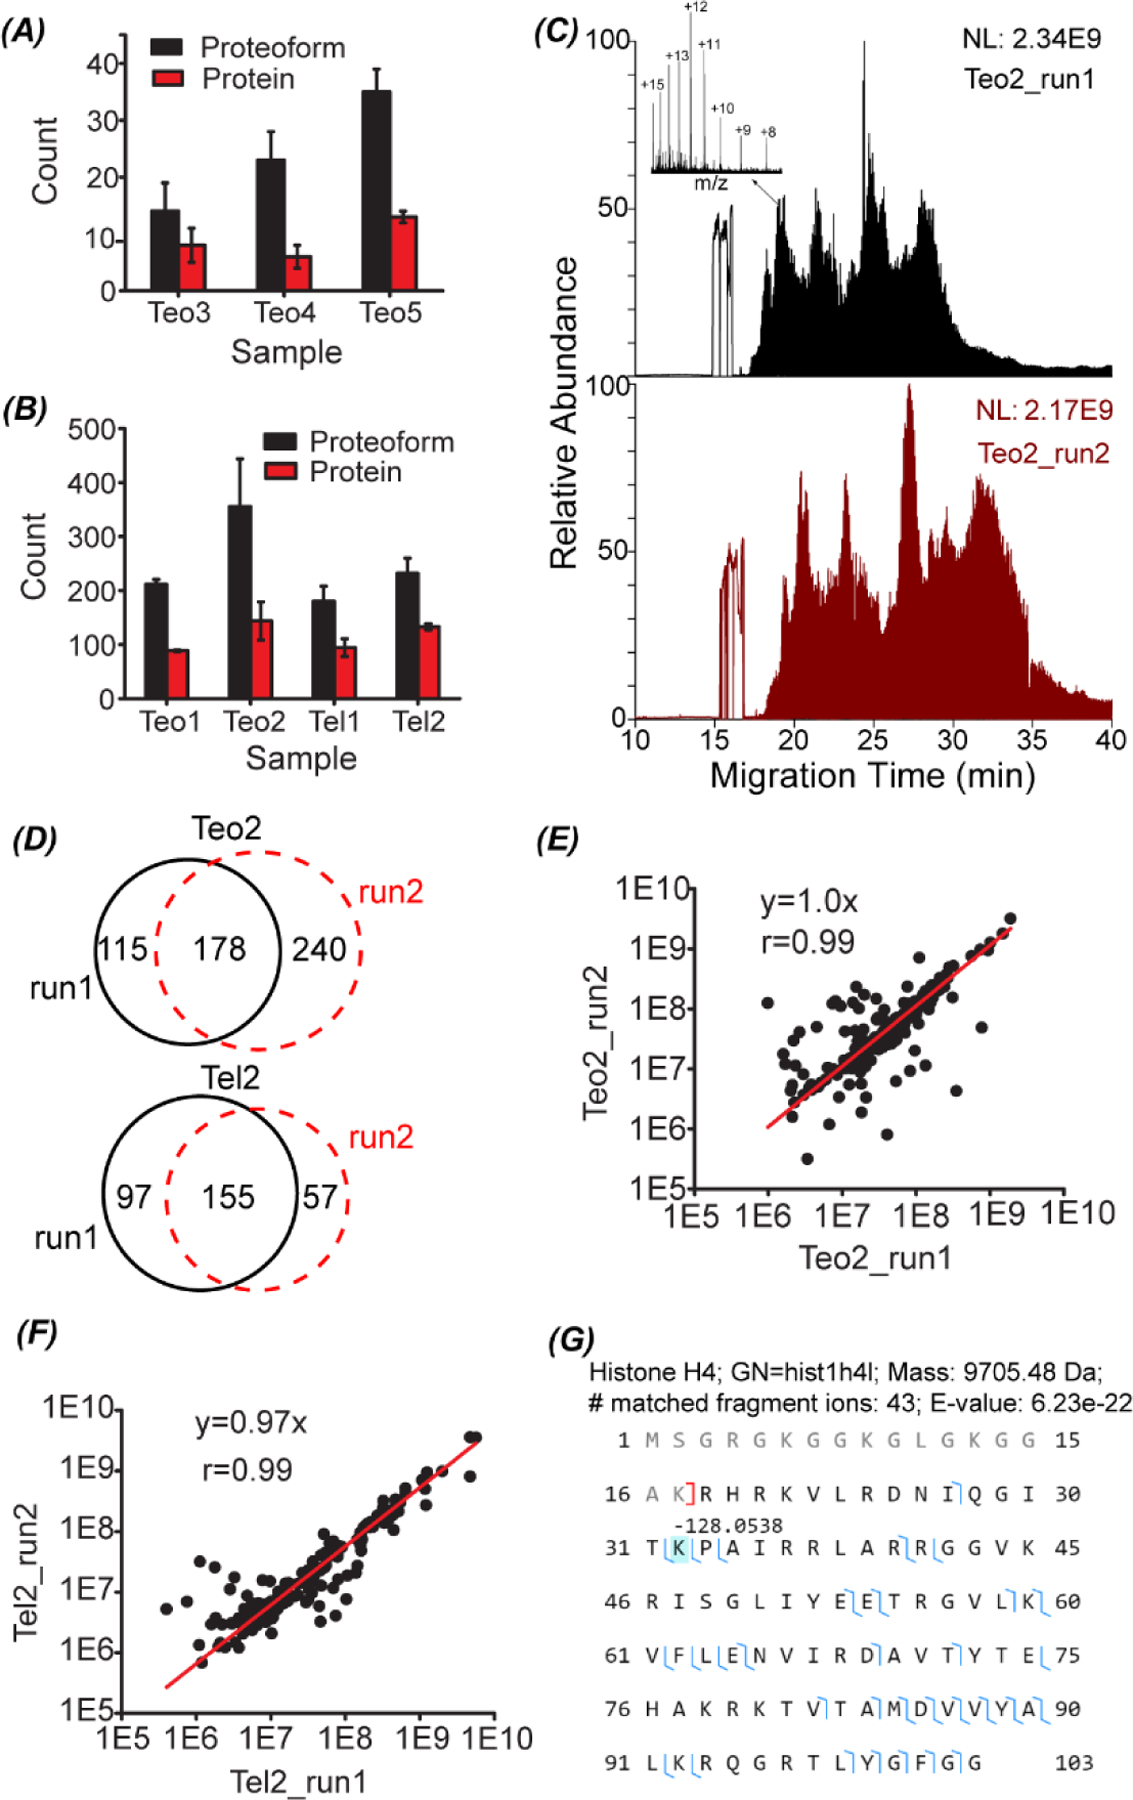
Fig. 3.

The number of proteoform and protein identifications from the LCM-CZE-MS/MS experiments using the OG-sonication sample preparation method (A) and OG-freeze–thaw method (B). The error bars represent the standard deviations of the number of protein and proteoform identifications from duplicate CZE-MS/MS runs. (C) Total ion current (TIC) electropherograms of the Teo2 sample prepared by the OG-freeze–thaw method and analyzed by CZE-MS/MS in duplicate. One example proteoform mass spectrum is shown in the inserted figure. (D) Overlaps of identified proteoforms between duplicate CZE-MS/MS analyses of Teo2 and Tel2 samples prepared by the OG-freeze–thaw method. Correlations of proteoform intensity between duplicate analyses of Teo2 (E) and Tel2 (F) samples. (G) Sequence and fragmentation pattern of one identified histone H4 proteoform from the Teo2 sample.
