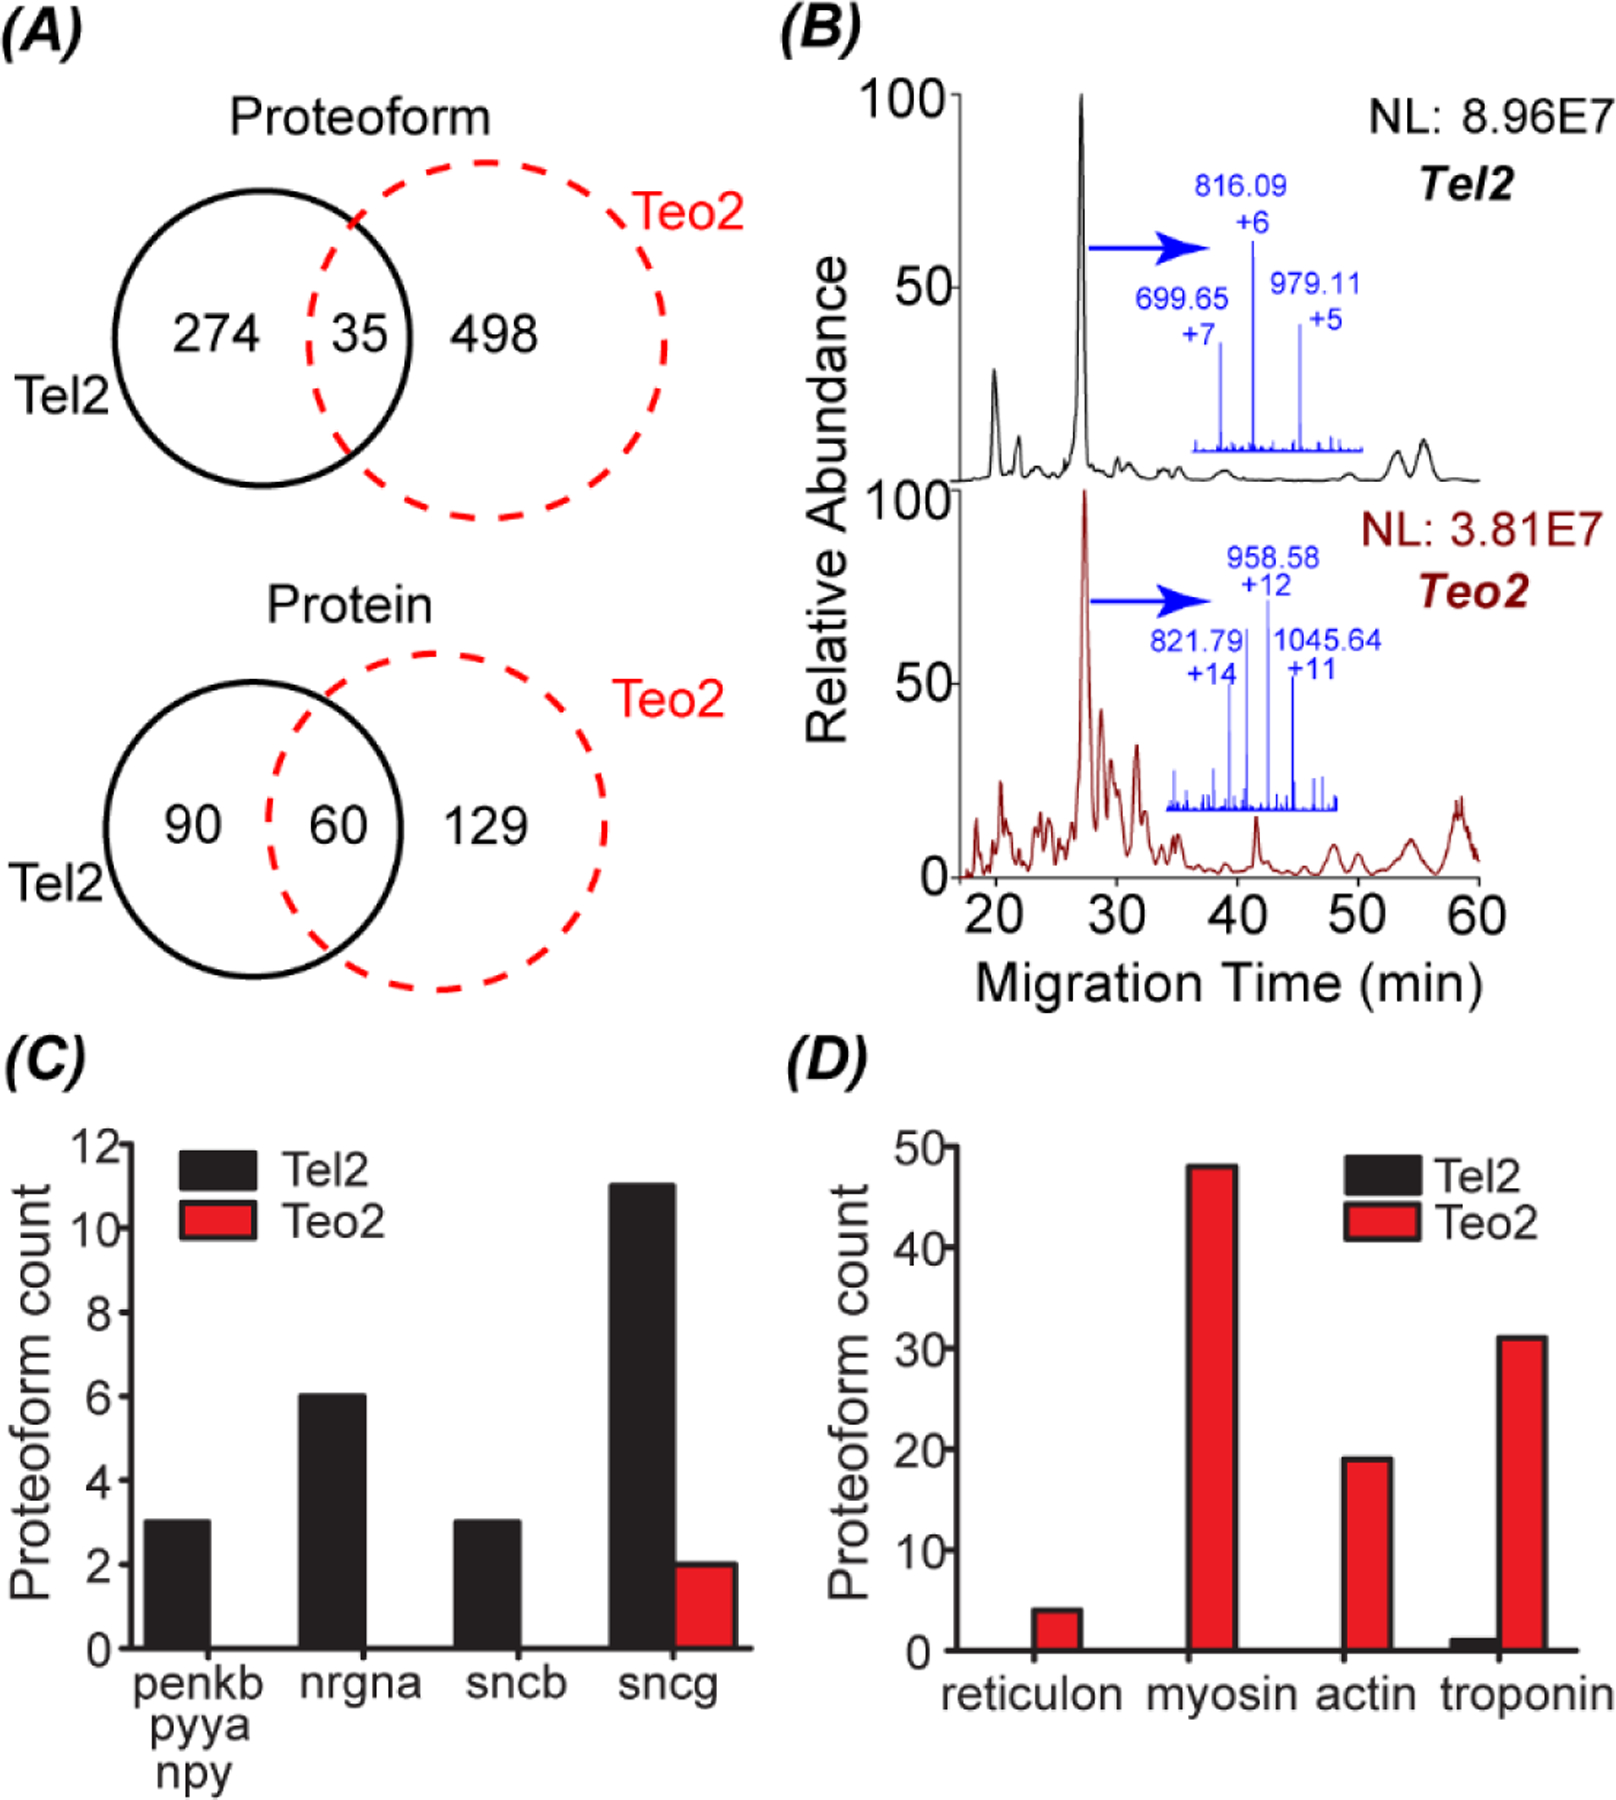
Fig. 4.

(A) Overlaps of identified proteoforms and proteins from Tel2 and Teo2 samples. The data was from the duplicate CZE-MS/MS analyses (technical replicates). (B) Base peak electropherograms of the Tel2 and Teo2 samples with the mass spectrum of the most abundant peak highlighted in the inserted figure. (C) The number of identified proteoforms of several genes from the Tel2 and Teo2 samples. For those genes, the Tel2 sample had much more proteoforms than the Teo2 sample. (D) The number of identified proteoforms of several genes from the Tel2 and Teo2 samples. For those genes, the Teo2 sample had much more proteoforms than the Tel2 sample.
