Fig. 1.
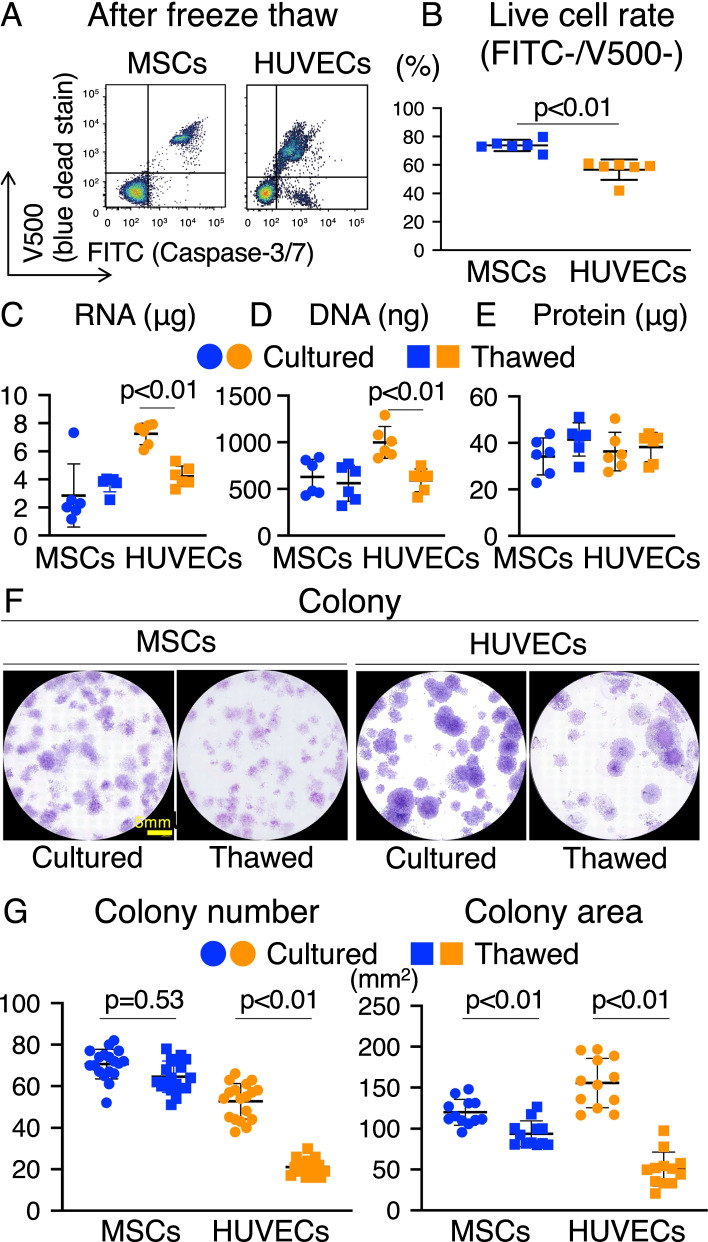
Freeze–thaw tolerance of MSCs and HUVECs. a Flow cytometric analysis of synovial MSCs and HUVECs after freeze-thawing. FITC-caspase-3/7 and V500-SYTOX™ blue dead cell staining is shown. b Live cell rate of synovial MSCs and HUVECs. Cells negative for FITC and V500 were considered live cells. Mean values and SD are shown (n = 6). The p value was calculated using the Mann–Whitney test. c RNA content in synovial MSCs and HUVECs (3.0 × 10⁵) before and after freeze-thawing. The mean values and SD are shown (n = 6). The p value was calculated using the Mann–Whitney test. d DNA content in synovial MSCs and HUVECs (3.0 × 10⁵) before and after freeze-thawing. The mean values and SD are shown (n = 6). The p value was calculated using the Mann–Whitney test. e Protein concentrations in synovial MSCs and HUVECs (3.0 × 10⁵) before and after freeze-thawing. The mean values and SD are shown (n = 6). The p value was calculated using the Mann–Whitney test. f Colony forming units (CFUs) of synovial MSCs and HUVECs before and after freeze-thawing. Representative dishes stained with crystal violet are shown. g CFUs after 12 days in culture before and after freeze-thawing. The mean values and SD are shown (n = 18). h Colony area after 12 days in culture before and after freeze-thawing. Mean values and SD are shown (n = 12). Cultured: fresh cells as seen before freeze-thawing. Thawed: cells immediately observed after freeze-thawing. The p value was calculated using the Kruskal–Wallis test with the Steel–Dwass multiple comparisons test

