Fig. 1.
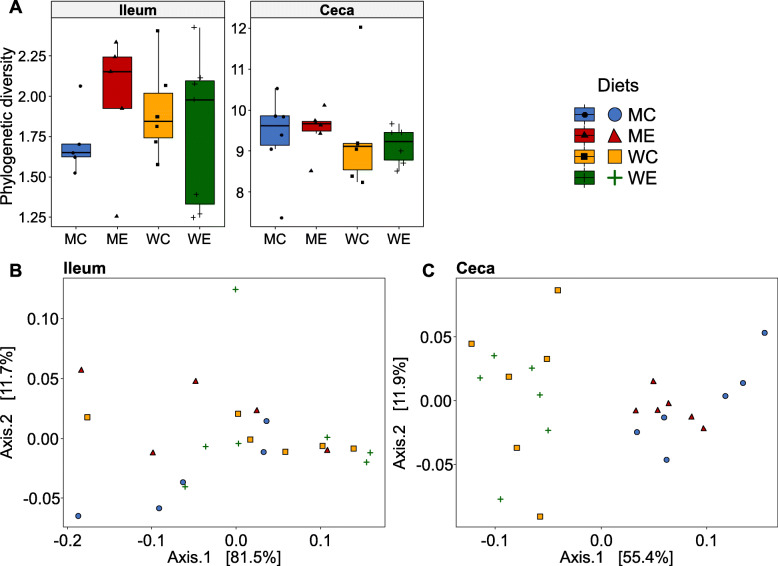
Alpha and beta diversity in the ileum and the ceca across dietary treatments; maize control (MC), maize enzyme (ME), wheat control (WC) and wheat enzyme (WE), (A) Phylogenetic diversity (ASV level) across dietary treatments. Whiskers show 95% interval, box 50% interval. Pairwise Wilcoxon rank sum tests (separately for ileum and ceca), corrected for multiple comparisons using the Benjamini-Hochberg procedure showed no difference between groups, (B) Principal coordinate plots (PCoA) based on weighted UniFrac distances of ileum samples. C Principal coordinate plots (PCoA) based on weighted UniFrac distances of ceca samples

