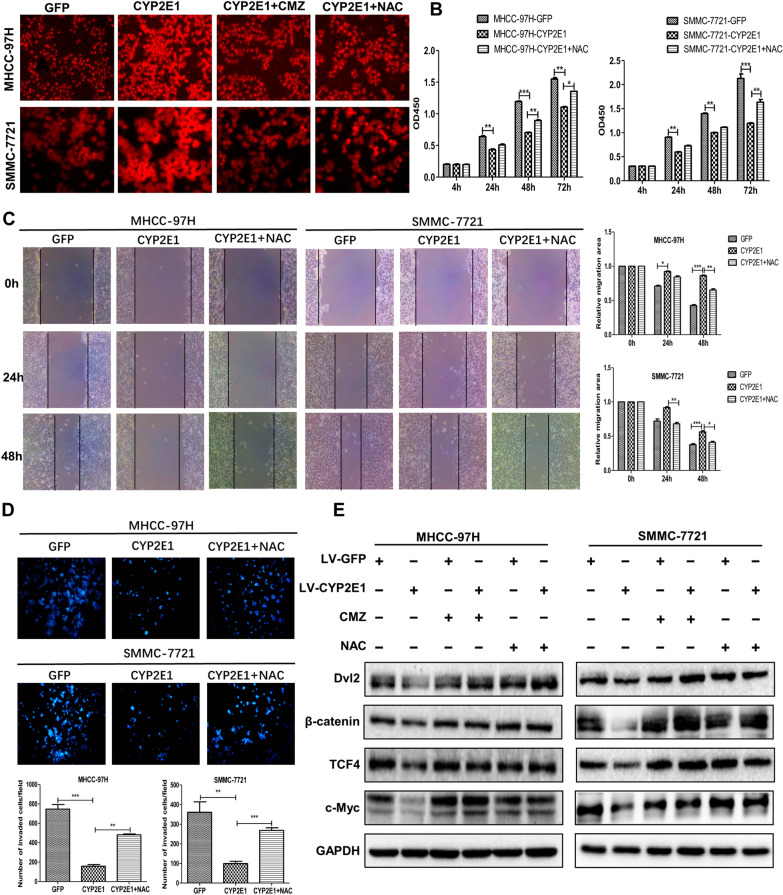
Fig. 5.
CYP2E1-inhibited Wnt/β-catenin signaling by ROS. A ROS level in control and CYP2E1-overexpressing HCC cells detected by fluorescence probe and the change in ROS level after treatment with the CYP2E1 inhibitor CMZ (40 μM) or the antioxidant NAC (10 mM) for 6 h in the indicated cells. B The OD450 value of MHCC-97H-CYP2E1, SMMC-7721-CYP2E1 and the respective control cells after treatment with NAC (10 mM) at the indicated time points. C Representative images and statistical analysis (right panel) of scratch wound assays of MHCC-97H-CYP2E1, SMMC-7721-CYP2E1 and the respective control cells after treatment with NAC (10 mM) (×100). D Representative images and statistical analysis (down panel) of transwell assays of MHCC-97H-CYP2E1, SMMC-7721-CYP2E1, and the respective control cells after treatment with NAC (10 mM) (×100). E After treatment with the CYP2E1 inhibitor CMZ (40 μM) or the antioxidant NAC (10 mM) for 6 h, the protein levels of Dv1-2, β-catenin, TCF4 and c-Myc in MHCC-97H-CYP2E1, SMMC-7721-CYP2E1 and the respective control cells were evaluated by western blot. Data in 5B, 5C and 5D are shown as mean ± sd (n = 3–6 in each assay). *P ≤ 0.05, **P ≤ 0.01, ***P ≤ 0.001 vs. CYP2E1

