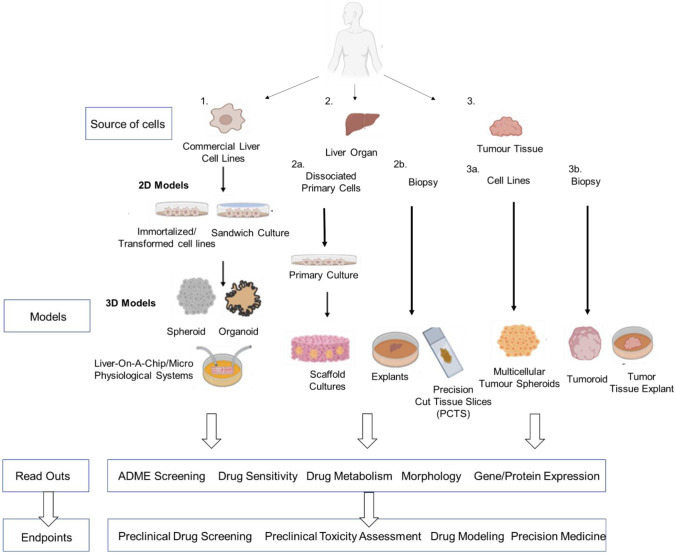
Fig. 3.
Overview of the various 2D and 3D in vitro models of the liver. Flow diagram illustrates the
source of liver cell/tissue, their potential 2D and 3D models which can be formed from both sources, the readouts that can be potentially measured, and their associated experimental endpoints. Figure adapted from Hepatocellular carcinoma, Chapter 3: In vitro models of the liver: disease modelling, drug discovery and clinical applications [14]

