Abstract
Cost-effective valorization of lignin into carbon-based electrode materials remains a challenge. Here we reported a facile and ultrafast laser writing technique to convert lignin into porous graphene as active electrode material for solid-state supercapacitors (SCs). During laser writing, alkaline lignin experienced graphitization. By controlling laser parameters such as power the porous structure and graphitization degree can be well modulated. Graphene obtained at 80% of laser power setting (LIG-80) had higher graphene quality and more porous structure than that obtained at the lower power levels (i.e., 50%, 70%). TEM images revealed that LIG-80 had few-layer graphene structure with fringe-like patterns. LIG-80 proved to be an active electrode material for SCs with a specific capacitance as high as 25.44 mF cm−2 in a H2SO4/PVA gel electrolyte, which is comparable or even superior to SCs based on pristine LIG obtained from other carbon precursors. Taken together, our proposed technical route for lignin-based LIG and subsequent application in SCs would not only open a new avenue to lignin valorization, but also produce porous graphene from a renewable carbon precursor for energy storage applications.
Direct laser writing transforms alkaline lignin into porous graphene for solid-state supercapacitors with high electrochemical performance.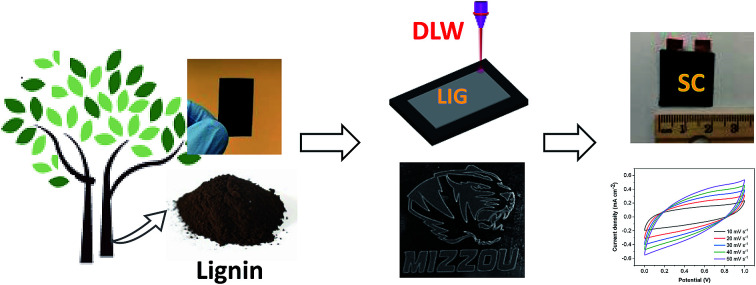
1. Introduction
Lignin accounts for 15–35% of lignocellulosic biomass by weight, and is the second most abundant biopolymer of any kind on earth next to cellulose.1 Lignin is also the most abundant naturally occurring aromatic polymer, with its complex structure built on aromatic subunits. At present, about 50 million tons of lignin are generated annually by the paper and pulp industry. Substantially more lignin would be generated upon the emergence of cellulosic biorefinery, with a quantity estimated at 62 million tons annually.2 Despite tremendous efforts made over the decades to valorize lignin, most of lignin generated in large-scale industrial plants is still treated as a waste byproduct and often burned for heat and power supply. Only about 2% of technical lignin is exploited for high value-added conversion.2–4 Recently lignin valorization has been regarded pivotal for profitable paper mills and biorefinery operations.2 Therefore, there is a critical need to advance the technologies to upgrade lignin into high value-added products. Given its high carbon content and abundant aromatic subunits, lignin has been explored as a preferred precursor for carbon-based electrode materials.5 Lignin-derived electrodes have been prepared mainly via electrospinning and templating methods followed by pyrolysis.6–9 The obtained porous carbon may stand out in terms of porosity distribution and energy storage capacities.10,11 However, these methods suffer from complicated fabrication procedures and high energy inputs. Template-free and solvent-free methods can simplify fabrication, but still require prolonged high-temperature treatment, like pyrolysis.12,13 The drawbacks with current methods would hinder low cost, mass production of lignin-derived electrode materials. Therefore, a simple, green, and low-cost route for lignin upgrading into carbon-based electrode materials is highly desired.
Among all carbon materials, porous graphitic carbon, such as 3D porous graphene network, is receiving increasing interests, due to its high electrical conductivity, good thermal stability, and high specific surface area.14,15 The general strategies are graphene oxide (GO) reduction and chemical vapor deposition (CVD), but these techniques rely on either corrosive multistep reactions or energy-intensive thermal treatment, which limits their large-scale application. Recently direct laser writing (DLW) technique is emerging as a facile and scalable process for porous graphene production.16–18 It uses a commercial infrared CO2 laser as an energy source to convert carbon precursors to porous graphene. Laser-induced graphene (LIG) exhibits hierarchical porous structure with large surface area, excellent conductivity, and high thermal stability.16 DLW is a one-step, energy-saving, chemical-free process conducted under ambient temperature, which overcomes the limitations of the aforementioned GO reduction and CVD methods. Moreover, it allows for roll-to-roll manufacturing, thus enabling large-scale fabrication of graphitic carbon. LIG has been used for various applications, such as supercapacitors, microfluidic devices, catalysts, and pressure sensors.14,19,20 LIG-based SCs were shown to have high capacitance due to hierarchical porous structures and high conductivity.16,21 They offer more energy or power density or both than commercial aluminum electrolytic capacitors, thin film lithium-ion batteries, and activated-carbon supercapacitors.16
Laser writing/irradiation induces localized high temperature and pressure, which provides unique reaction conditions for graphene formation.22 LIG properties, including porosity, surface chemistry, and composition, can be tuned by regulating laser parameters (e.g., power, scan rate) and precursor composition/structure.14 Among laser parameters, laser power plays a key role in tailoring morphology and structure of LIG.16 In general, a threshold power level is required for the induction of graphene formation, and higher power level above the threshold leads to higher graphene quality. However, too strong laser power can damage graphene structure and even ablate carbon precursors. In terms of carbon precursor, DLW can be applied to both synthetic polymers and naturally occurring materials for graphene formation.23 Compared to synthetic polymers, biomass is an attractive precursor due to its renewability, abundance, and low cost. Lignin as a major constituent in biomass was shown to make significant contribution to LIG formation, and biomass with higher lignin contents favors graphene formation.23,24 A recent prior study also showed that LIG can be formed from alkaline lignin, a kind of technical lignin extracted from biomass, and subsequent on-chip interdigitated microsupercapacitors (MSCs) had similar capacitance to those made from polyimide (PI)-based LIG electrode.25 Given aromatic structure and abundant availability, technical lignin warrants further exploration for LIG formation toward energy storage application. Such implementation would enable scalable, cost-effective lignin upgrading into high-value graphene-based carbon materials and high-performance energy storage devices.
In this study, we focused on upgrading lignin into LIG and further assembling it into solid-state SCs with high electrochemical performance. Lignin film composed of alkaline lignin and PEO (serving as a binder for film fabrication) was used as precursor for LIG production. Different laser powers were applied to induce graphene from lignin. Obtained LIG was characterized for structural and chemical properties via a series of analytical techniques. Finally, sandwiched SCs were fabricated using lignin-based LIG electrodes and H2SO4/PVA gel electrolyte, and evaluated for their electrochemical performance.
2. Materials and methods
2.1. Lignin film preparation
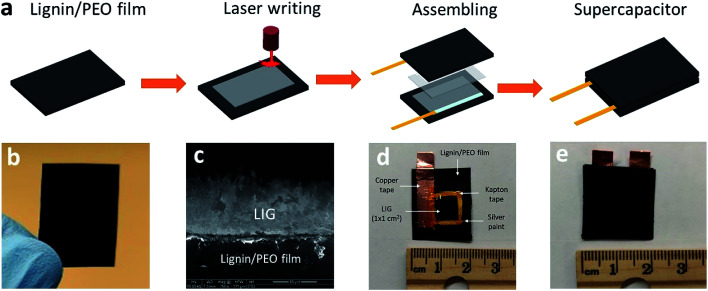
Water-soluble softwood alkaline lignin (AL) (TCI America™, Mfr No. L0082500G) was purchased from Fisher Scientific (Hampton, NH, USA) and used as received. Below is the procedure for lignin film fabrication. First, 0.75 g of PEO (Polyox™ WSR 301, MW = 4 × 10⁶) was mixed with 20 mL of water, and then continuously stirred at room temperature until a clear, viscous PEO solution was formed. Thereafter, 1.5 g of AL was added to the as-prepared 20 mL of PEO solution. After stirring overnight, a viscous, dark brown solution was obtained, which was further cast onto a 9 cm plastic Petri dish for the film formation. After drying in open air, lignin film comprising AL and PEO with a weight mixing ratio of 2 : 1 was peeled off from the Petri dish and then cut into desired dimensions. All the films were stored in covered Petri dish in room temperature prior to use. A representative AL/PEO film is shown in Fig. 1b.
Fig. 1. Process of converting lignin to LIG and subsequent SC fabrication. (a) Overview of the DLW process and device fabrication. (b) An AL/PEO film. (c) Cross-sectional SEM image of LIG-80 (scale bar is 50 μm, showing LIG thickness of ∼53 μm). (d) Assembled single electrode, with 1 M H2SO4/PVA gel electrolyte applied. (e) Fully assembled sandwich-like SC using two LIG electrodes derived from lignin.
2.2. Laser writing
Lignin films were first attached to a stage by a removable double-sided Scotch tape in order to avoid the deformation of films due to drastically increased temperature during laser writing. A 10.6 μm CO2 laser (H-Series 20 × 12 Desktop laser, Full Spectrum, Les Vegas, NV) with an upper power of 40 W and a pulse duration of ∼14 μs was used for scribing lignin film. All the scribing tests were performed under ambient conditions with a beam size of ∼100 μm, a scan rate of 20 cm s−1, and an image density of 1000 pulses per inch (PPI). Laser power effects were studied by applying 50–90% of 40 W laser power setting. Scribed lignin film was denoted as LIG-X, where X stands for power percentage of the laser.
2.3. SCs fabrication
Lignin-based LIG was used as both electrode and current collector for SCs. The following procedure was followed to assemble LIG electrode. Silver paint (Pellco®, Catalog No. 16034, Ted Pella, Redding, CA) was applied to the edge of LIG (1 cm2) embedded on the lignin film for better electrical connection and extended with conductive copper tapes. A Kapton® PI tape was employed on the silver paint and portion of the copper tape to avoid their contact with electrolyte. After assembly, one LIG electrode was coated with 1.0 M PVA/H2SO4 gel electrolyte and then stacked with another electrode, forming a sandwiched SC, as depicted in Fig. 1a. PVA/H2SO4 gel electrolyte was prepared by mixing 1.0 g of H2SO4 and 1.0 g of PVA (MW = 124 000–186 000) in 10 g of H2O until a clear gel was formed. Fabricated SCs were placed in vacuum desiccator to allow gel electrolyte to become completely dry. After device fabrication, the conductive copper tape was attached to an electrochemical workstation for electrochemical analysis.
2.4. Characterization
Morphology of LIG was examined using FEI Quanta 600 FEG environmental scanning electron microscope (ESEM) equipped with a Bruker Quantax 200 Silicon Drift Detector and operated at 15 kV and 100 pA. Scribed lignin films were cut into small dimensions and mounted onto an adhesive SEM sample holder for imaging. The thickness of LIG was measured via SEM imaging of cross-section of scribed lignin film. High resolution transmission electron microscopy (HRTEM) was used to exam microstructure and nanostructure of LIG. TEM images were taken on FEI Tecnai F30 Twin 300 kV TEM. LIG powder was scrapped from scribed lignin film and sonicated for 5 min in ethanol before being transferred onto a C-flat TEM grid for imaging. Raman spectra were acquired on a Renishaw inVia™ Raman Spectrometer at 633 nm. X-ray diffraction (XRD) patterns were acquired on a Scintag X2 diffractometer equipped with a Cu Kα radiation (Scintag, Inc., Cupertino, CA). Survey scans were conducted at 0.02° step size with a scanning rate of 6 s/0.02°, while detailed peak analyses were conducted at the same step size but with a scanning rate of 12 s/0.02°. X-ray photoelectron spectra were acquired on a Kratos Axis 165 Photoelectron spectroscopy system with a vacuum level of 3.0 × 10⁻⁸ Torr. Survey spectra were recorded in a step size of 0.5 eV with pass energy of 160 eV, while high resolution elemental spectra were recorded in 0.1 eV with pass energy of 20 eV. All the spectra were corrected using the C 1s peak (284.4 eV) as reference.
Based on Raman spectra data, the crystalline size of graphitic carbon in the a axis (La) was calculated from the intensity ratio of G peak (IG) and D peak (ID) following eqn (1):26
 |
1 |
where λl is the wavelength of the Raman laser (λl = 633 nm).
2.5. Electrochemical analysis
Cyclic voltammetry (CV) and galvanostatic charge–discharge (CD) measurements were conducted on CHI 660D electrochemical workstation (CHI Instruments, USA). The CV tests were carried out at an operating voltage (0–1.0 V) with different scan rates ranging from 10 to 500 mV s−1. The CD tests were performed with current densities in a range of 0.1–1.0 mA cm−2. Unlike conventional SCs whose performance was evaluated based on mass of active materials, the proposed SCs, similar to MSCs, have much less mass of active materials and thus their footprint area becomes the key consideration.27 Here areal capacitance (CA) and volumetric capacitance (CV) were calculated, which was further used for the calculation of spatial energy and power densities.
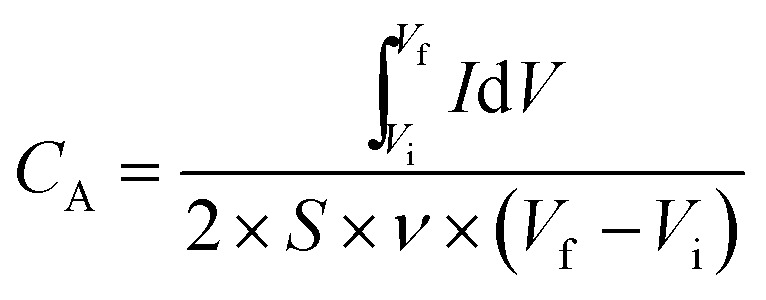
The specific areal capacitance (CA, in mF cm−2) based on CV curves was calculated following eqn (2) below:
 |
2 |
where S is the surface area (in cm2) of an active LIG electrode, with 1 cm2 for the device configuration in this work; ν is the voltage scan rate (in V s−1); Vf and Vi are the potential limits used for the CV analysis (in V); I is the voltammetry current (in A); and 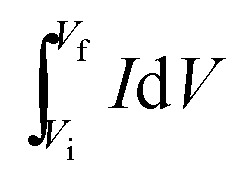 denotes the integrated area of CV curve.
The CA (in mF cm−2) based on the CD curves was calculated using eqn (3):
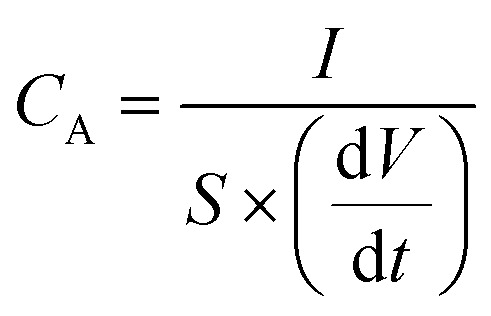 |
3 |
where I is the discharge current (in A); S is the surface area of the LIG (cm2), with 1 cm2 for the device configuration here; and dV/dt is the slope of the galvanostatic discharge curves.
The volumetric capacitance (CV) (in mF cm−3) based on either CV or CD curves was calculated by dividing CA by the thickness of active material (d, in cm) following eqn (4):
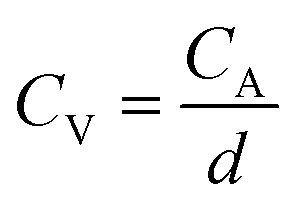 |
4 |
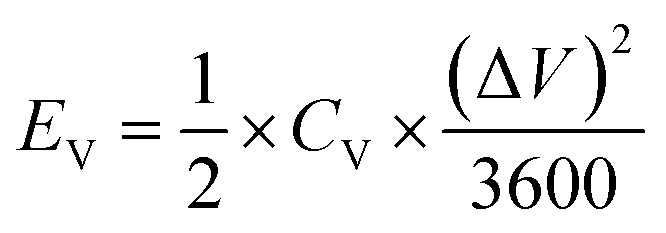
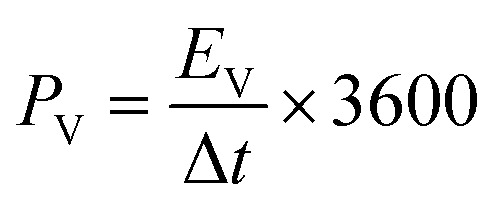
The specific areal energy (EA in mW h cm−2) and power (PA, in mW cm−2) densities were calculated by eqn (5) and (6), respectively. For the specific volumetric energy (EV, in mW h cm−3) and power (PV, in mW cm−3) densities, eqn (7) and (8) were used for the calculations, respectively.
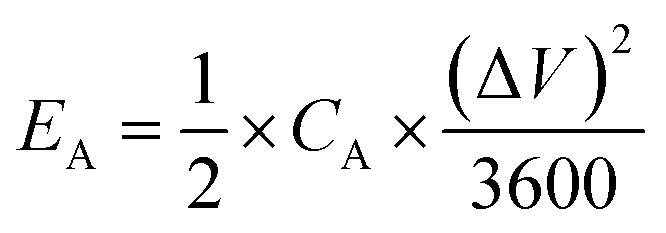 |
5 |
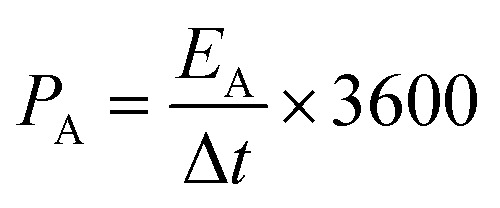 |
6 |
 |
7 |
 |
8 |
where CA and CV are based on CD curves and calculated by eqn (3) and (4), respectively; ΔV = Vmax − Vdrop is equivalent to the discharge potential range (Vmax is the voltage of 1 V for H2SO4/PVA gel electrolyte); Vdrop is the voltage drop indicated from the difference of the first two points in the data obtained from the discharge curves; and Δt is the discharge time (in s).
3. Results and discussion
3.1. Characterization of lignin-derived LIG
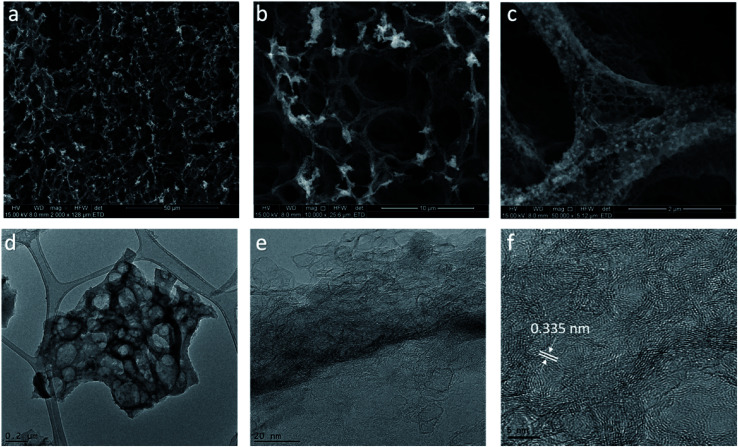
Lignin-derived LIG film was characterized for its morphology and structural properties by ESEM and HRTEM. The morphology of the lignin film irradiated with 80% laser power setting (denoted as LIG-80) was depicted in Fig. 2a–c. It showed a typical porous foam-like structure with numerous macrospores, which is very similar to that of LIG derived from PI (Fig. 2a).16 The cross-sectional SEM image of laser-irradiated lignin film showed a porous layer with ∼53 μm thickness embedded on the film (Fig. 1c). SEM images at high magnification also showed beehive-like nanoporous structure with a mixture of mesopores and macropores in the carbon matrix (Fig. 2c and S1†). The highly porous structure was caused by the rapid liberation of gaseous molecules (e.g., CO2, H2O) resulting from the degradation of PEO and partial decomposition of lignin upon laser irradiation.28 On the other hand, pure PEO film cannot be induced into graphene upon laser irradiation. Since laser irradiation is a photothermal treatment in principle, laser intensity/power is a key variable for inducing graphene from carbon precursor.16,24 By applying a wide range of laser power (50–90%), we found that morphology and porous structure of LIG evolved with the change in power level (Fig. S2†). Laser writing at 50% laser power or above opened up pores of the film, and a higher power level led to more porous structures. However, when the power level reached 90%, it had deleterious effects, and the cracks on the film were visible due to the severity of photothermal treatment as previously reported.24 Taken together, laser irradiation with an optimal power range led to the formation of hierarchical porous carbon from lignin, particularly graphene carbon as identified below. Such hierarchical porous structure is beneficial for electrochemical performance, as it can provide enhanced accessible surface area and facilitate fast diffusion of electrolyte into electrode.29,30
Fig. 2. Morphology and structure of LIG-80. (a) SEM image; scale bar is 50 μm. (b and c) High resolution SEM images; scale bars are 10 μm and 2 μm, respectively. (d) TEM image; scale bar is 0.2 μm. (e and f) HRTEM images; scale bars are 20 nm and 5 nm, respectively. LIG embedded on the lignin/PEO film was used for SEM imaging, while LIG powder scraped from the lignin/PEO film was used for TEM imaging.
More detailed structures of lignin-derived carbon were characterized by TEM (Fig. 2d–f). HRTEM image of LIG-80 displayed graphene fringes with a characteristic of 0.335 nm d-spacing, corresponding to the gap between two adjacent (002) planes in graphitic carbon (Fig. 2f). Graphene was also shown to have thin flakes with few-layer structures (Fig. 2f). Moreover, graphitic carbon formed at a higher laser power level exhibited more ordered structure (Fig. S3† and 2e). Porous graphene network with abundant defect-rich boundaries as mentioned below is suggested to have improved electrochemical capacitance compared to defect-free graphene structure.16
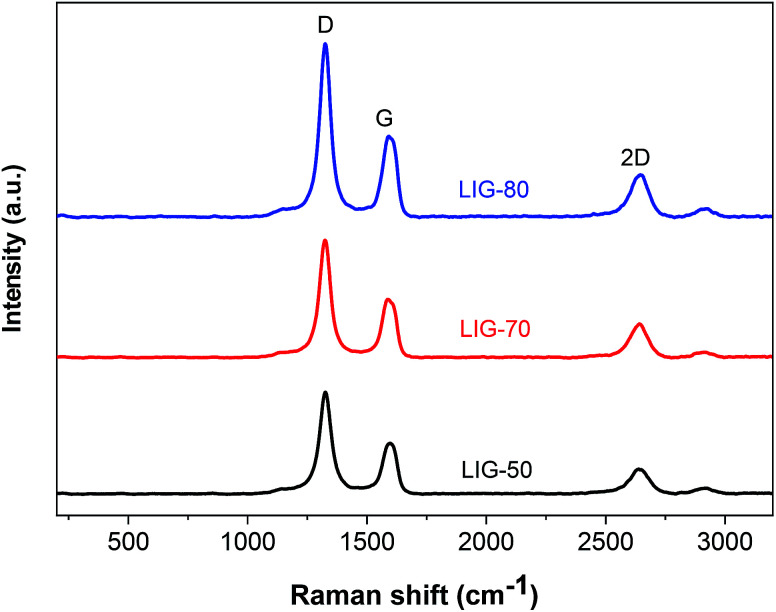
The presence of graphene in lignin-based LIG is also evidenced by Raman spectra, which showed three characteristic peaks of graphene, including a D peak at ≈1350 cm−1, a G peak at ≈1580, and a 2D peak at ≈2670 cm−1 (Fig. 3). The D peak is suggestive of defects or bent sp2-carbon bonds, whereas G peak is the first-order Raman band of all sp2 hybridized carbon.31 The 2D peak originates from second order zone boundary phonons.31 Compared to LIG obtained from the other two power levels (i.e., LIG-50, LIG-70), LIG-80 had the much stronger peak intensities. It also had the highest IG/ID ratio, with the average crystalline size calculated to be 41 nm. Moreover, LIG-80 had the highest I2D/IG ratio, indicating the fewest number of graphene layers.24 Although the D peak was not suppressed at a higher power (likely due to the presence of PEO in the lignin film), Raman spectra results suggested that by increasing the laser intensity from 50% to 80% power, higher quality graphene with more crystalline structure and less stacked layers can be generated from alkaline lignin.
Fig. 3. Raman spectra of LIG showing three prominent peaks (i.e., D, G, and 2D). The pristine lignin/PEO film showed no signals via Raman scan. LIG embedded on the lignin/PEO film was used for Raman spectroscopy.
Graphene formed in LIG-80 was further confirmed by X-ray diffraction (XRD) (Fig. S4†). The peak at 2θ ≈ 24.9° was assigned to (002) reflection (inset in Fig. S4†), indicating a d-spacing of 0.357 nm. This characteristic peak shifted to one degree lower than that reported for LIG derived from PI.16 This suggested larger interlayer spacing in the lignin-based LIG, which could be due to higher oxidation of lignin/PEO film upon laser irradiation. The slight disparity between XRD and HRTEM results also suggested that interlayer spacing can vary slightly from particle to particle (Fig. S4† and 2f). Nevertheless, the value of d-spacing obtained here was comparable to that reported for laser writing to generate graphene from graphite oxide.32 Overall, the XRD results supported that lignin was successfully transformed to graphene.
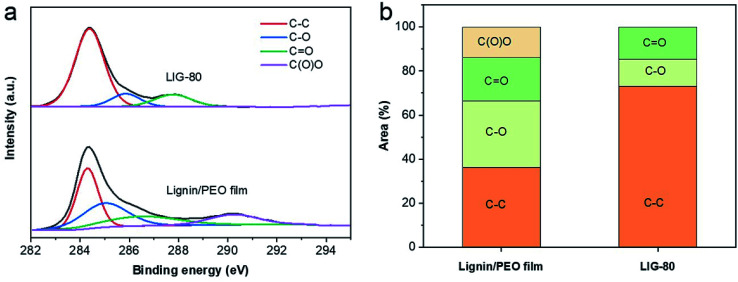
XPS spectra show that LIG-80 had significantly increased carbon content compared to the pristine (non-irradiated) lignin/PEO film (Fig. S5†). LIG-80 also contained small amounts of impurities (e.g., Na, S) originating from alkaline lignin. The content of Na was significantly reduced by laser irradiation, suggesting that lasing would induce combined photothermal and photochemical reactions. High resolution C 1s XPS spectra revealed four dominant peaks: sp2 C–C bond at ∼284.4 eV, C–O bond at ∼285.7 eV, C O bond at ∼288.5 eV, and O–C O bond at ∼290.5 eV (Fig. 4a). The sp2 C–C peak became dominant in LIG-80, accounting for 73.1% of C 1s major functional groups (Fig. 4b). The O–C O peak disappeared after laser irradiation. The content of C–C functionality in LIG-80 is comparable to that in LIG obtained from other biomass-based precursors (e.g., wood, nanocellulose, lignin/PVA film).23,24,33 Compared to PI film, biomass-based precursors have a lower degree of carbon enrichment and oxygen suppression upon laser irradiation, which would be attributed to highly functionalized structure of biomass or lignin. Nevertheless, the significant increase in C–C bond and decrease in C–O bond confirmed that lignin experienced carbonization and graphitization during laser scribing. As a result, LIG was dominated by sp2 carbon, which agreed well with the Raman and XRD results.
Fig. 4. XPS spectra. (a) High resolution C 1s XPS spectra. (b) Functionality revealed by high resolution C 1s XPS. LIG embedded on the lignin/PEO film was used for XPS spectroscopy, and the pristine lignin/PEO film used as a control.
3.2. Electrochemical performance of lignin-based LIG
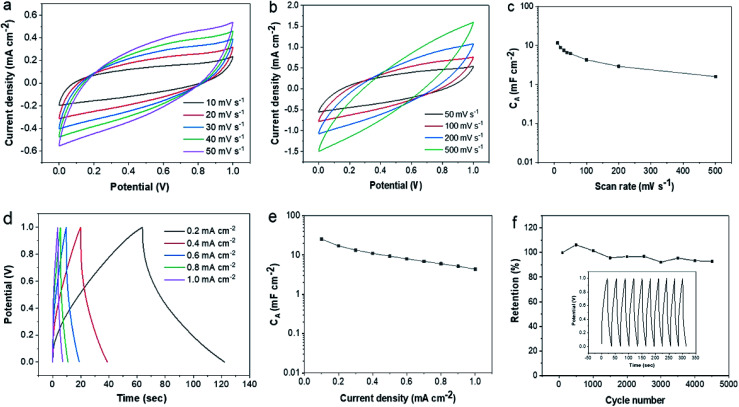
The above results indicated that laser writing facilely transformed lignin into hierarchical porous graphene. All the characteristics suggested that derived LIG has great promise for high-performance active electrodes. Here we assembled sandwiched SCs using lignin-based LIG as both electrode and current collector. The device architecture was depicted in Fig. 1a. The electrochemical performance of the fabricated LIG-SCs was evaluated based on their CV and CD measurements. The CV curves of LIG-80 at various scan rates (10–500 mV s−1) showed pseudo-rectangular shape, indicating good double-layer capacitive behaviors (Fig. 5a and b). The CA of LIG-80 as a function of scan rate was shown in Fig. 5c. At 10 and 20 mV s−1 scan rates, the SC had 11.64 and 8.84 mF cm−2CA, respectively. These CA values were almost double that obtained from SCs based on pristine LIG from PI film and aqueous 1 M H2SO4 electrolyte (e.g., ∼4.3 mF cm−2 at 20 mV s−1).16 When the scan rate was increased to 500 mV s−1, the CA still remained to be 1.59 mF cm−2. In contrast to LIG-80 electrode, the other two electrodes (i.e., LIG-50, LIG-70) also showed near pseudo-rectangular shape (Fig. S6a and b†), but had much lower capacitance (Fig. S6c†), which was also evidenced by their CV curves (Fig. S6d and e†). Significantly higher electrochemical performance of LIG-80 electrode could be attributed to its abundant wrinkle-/fringe-like graphene structure as revealed by HRTEM images (Fig. 2f).
Fig. 5. Electrochemical performance of LIG-80-SC in H2SO4/PVA gel electrolyte. (a and b) CV curves at different scan rates (measured at a scan rate of 10–500 mV s−1). (c) CA calculated from CV curves as a function of scan rate. (d) CD curves at various discharge current densities. (e) CA calculated from CD curves as a function of discharge current density. (f) Cycling stability during 4500 charge–discharge cycles at a current density of 0.2 mA cm−2; capacitance calculated from the CD curves at a current density of 0.2 mA cm−2; inset in (f) shows CD curves obtained for the first 10 cycles.
The charge/discharge (CD) curves of LIG-80 at different current densities (0.1–1.0 mA cm−1) are depicted in Fig. 5d. The CD curves were nearly triangle in shape, proving good capacitive behavior. From the initial stage of discharge, the voltage drop indicates slight internal resistance of the SC. The specific capacitance (CA) as a function of current density is presented in Fig. 5e. The CA was 25.44 mF cm−2 at a current density of 0.1 mA cm−2, with the corresponding specific volumetric capacitance (CV) of 4.80 F cm−3 (Fig. S7b†). It decreased gradually with increasing discharge current densities, but still delivered 9.36 and 4.38 mF cm−2 at the current densities of 0.5 and 1.0 mA cm−2, respectively. These values were comparable or even higher than those reported for SCs based on pristine LIG and some other carbon at the same current densities.16,25,34–38 For example, both interdigitated and sandwiched SCs using pristine LIG from PI film and 1 M PVA/H2SO4 gave about 8–9 mF cm−2 at 0.5 mA cm−2.21,34 In the study reported by Zhang et al.,25 lignin-based LIG coated with Au allowed interdigitated SCs with 1 M PVA/H2SO4 to reach maximal capacitance of 25.1 mF cm−2 (6.27 F cm−3) at 0.01 mA cm−2, which was much higher than non-coated LIG electrode counterpart, but its capacitance decreased significantly down to 10 mF cm−2 at a higher current density of 0.5 mA cm−2. It remains unclear in their study why higher quality LIG with more porous structure did not stand out on electrochemical capacity. In contrast, the SC fabricated using pristine LIG derived from lignin in the present work was able to deliver comparable capacitance even at a ten-fold current density. If LIG-80 is coated with conductive materials, such as Au and polyaniline, it is reasonably expected that derived SC would have much higher capacitance. These findings suggested that different device architecture and high quality lignin-based LIG can lead to good performance of SCs.
In addition, the fabricated lignin-based LIG-SCs were evaluated for their energy and power densities. As seen from the Ragone plots (Fig. S7c and d†), the device was able to deliver an EA of 3.45 μW h cm−2 and an EV of 0.651 mW h cm−3 at the current density of 0.1 mA cm−2. Even with a higher current density (0.5 mA cm−2), the EA and EV remained to be 1.16 μW h cm−2 and 0.2 mW h cm−3, respectively. The power densities reached 0.418 mW cm−2 (PA) and 78.86 mW cm−3 (PV) at a current density of 0.5 mA cm−2, which are about half of that calculated at 1 mA cm−2. Compared to typical commercial SCs (5.5 V/100 mF) and other LIG-based MSCs/SCs,17 our proposed device can offer comparable or even higher energy/power densities. The SC device also demonstrated good electrochemical stability. After 4500 cycles, more than 93% of the initial capacitance was retained (Fig. 5f). Overall, lignin-based LIG proved to be a highly promising active electrode material for energy storage application.
4. Conclusion
We have demonstrated a facile route to produce porous graphene from alkaline lignin using laser writing. Laser power was found to have significant effects on the formation of porous structure and degree of graphitization. By applying 80% of the laser power setting (40 W), hierarchical porous graphene was obtained from lignin film, which exhibited few-layered graphene with high crystallinity. LIG-80 demonstrated good electrochemical performance. The SC based on LIG-80 as both electrode and current collector delivered a high capacitance of 25.44 mF cm−2 (corresponding to 4.80 F cm−3), an energy density of 0.651 mW h cm−3, and a power density of 148 mW cm−3. These findings suggested that lignin was successfully transformed into high quality porous LIG, which can be subsequently used for the fabrication of high-performance, solid-state SCs. This study opens a new avenue to cost-effective lignin upgrading to value-added electrode materials. It would promote future research in using cheap technical lignin as carbon precursor for graphene fabrication. The simple laser writing process for lignin valorization toward energy storage devices shows great promise for low-cost, scalable application.
Conflicts of interest
The authors declare no conflict of interest.
Supplementary Material
Acknowledgments
We thank the support from the University of Missouri Electron Microscopy Core facility. We also thank Dr Steven Kelley at the Department of Chemistry in University of Missouri for his help with XRD analysis.
Electronic supplementary information (ESI) available. See DOI: 10.1039/c9ra04073k
References
- Rinaldi R. Jastrzebski R. Clough M. T. Ralph J. Kennema M. Bruijnincx P. C. A. Weckhuysen B. M. Angew. Chem., Int. Ed. 2016;55:8164–8215. doi: 10.1002/anie.201510351. [DOI] [PMC free article] [PubMed] [Google Scholar]
- Ragauskas A. J. Beckham G. T. Biddy M. J. Chandra R. Chen F. Davis M. F. Davison B. H. Dixon R. A. Gilna P. Keller M. Langan P. Naskar A. K. Saddler J. N. Tschaplinski T. J. Tuskan G. A. Wyman C. E. Science. 2014;344:1246843. doi: 10.1126/science.1246843. [DOI] [PubMed] [Google Scholar]
- Zakzeski J. Bruijnincx P. C. Jongerius A. L. Weckhuysen B. M. Chem. Rev. 2010;110:3552–3599. doi: 10.1021/cr900354u. [DOI] [PubMed] [Google Scholar]
- Laurichesse S. Avérous L. Prog. Polym. Sci. 2014;39:1266–1290. doi: 10.1016/j.progpolymsci.2013.11.004. [DOI] [Google Scholar]
- Chatterjee S. Saito T. ChemSusChem. 2015;8:3941–3958. doi: 10.1002/cssc.201500692. [DOI] [PubMed] [Google Scholar]
- Hu S. Hsieh Y.-L. RSC Adv. 2017;7:30459–30468. doi: 10.1039/C7RA00103G. [DOI] [Google Scholar]
- Guo N. Li M. Sun X. Wang F. Yang R. Green Chem. 2017;19:2595–2602. doi: 10.1039/C7GC00506G. [DOI] [Google Scholar]
- Song Y. Liu J. Sun K. Xu W. RSC Adv. 2017;7:48324–48332. doi: 10.1039/C7RA09464G. [DOI] [Google Scholar]
- Zhang W. Zhao M. Liu R. Wang X. Lin H. Colloids Surf., A. 2015;484:518–527. doi: 10.1016/j.colsurfa.2015.08.030. [DOI] [Google Scholar]
- Ma C. Li Z. Li J. Fan Q. Wu L. Shi J. Song Y. Appl. Surf. Sci. 2018;456:568–576. doi: 10.1016/j.apsusc.2018.06.189. [DOI] [Google Scholar]
- Yang J. Wang Y. Luo J. Chen L. ACS Omega. 2018;3:4647–4656. doi: 10.1021/acsomega.7b01876. [DOI] [PMC free article] [PubMed] [Google Scholar]
- Jeon J. W. Zhang L. B. Lutkenhaus J. L. Laskar D. D. Lemmon J. P. Choi D. Nandasiri M. I. Hashmi A. Xu J. Motkuri R. K. Fernandez C. A. Liu J. Tucker M. P. McGrail P. B. Yang B. Nune S. K. ChemSusChem. 2015;8:428–432. doi: 10.1002/cssc.201402621. [DOI] [PubMed] [Google Scholar]
- Ho H. C. Nguyen N. A. Meek K. M. Alonso D. M. Hakim S. H. Naskar A. K. ChemSusChem. 2018;11:2953–2959. doi: 10.1002/cssc.201800929. [DOI] [PubMed] [Google Scholar]
- Ye R. James D. K. Tour J. M. Acc. Chem. Res. 2018;51:1609–1620. doi: 10.1021/acs.accounts.8b00084. [DOI] [PubMed] [Google Scholar]
- Raccichini R. Varzi A. Passerini S. Scrosati B. Nat. Mater. 2015;14:271. doi: 10.1038/nmat4170. [DOI] [PubMed] [Google Scholar]
- Lin J. Peng Z. Liu Y. Ruiz-Zepeda F. Ye R. Samuel E. L. G. Yacaman M. J. Yakobson B. I. Tour J. M. Nat. Commun. 2014;5:5714. doi: 10.1038/ncomms6714. [DOI] [PMC free article] [PubMed] [Google Scholar]
- Ye R. James D. K. Tour J. M. Adv. Mater. 2018;31:1803621. doi: 10.1002/adma.201803621. [DOI] [PubMed] [Google Scholar]
- El-Kady M. F. Strong V. Dubin S. Kaner R. B. Science. 2012;335:1326–1330. doi: 10.1126/science.1216744. [DOI] [PubMed] [Google Scholar]
- Zhang C. Zhang C. Xie Y. Su J.-W. He X. Demaree J. D. Griep M. H. Atwood J. L. Lin J. Chem.–Eur. J. 2019;25:4036–4039. doi: 10.1002/chem.201805152. [DOI] [PubMed] [Google Scholar]
- Xie Y. Zhang C. He X. White T. Demaree J. D. Griep M. Lin J. J. Power Sources. 2018;397:37–43. doi: 10.1016/j.jpowsour.2018.06.099. [DOI] [Google Scholar]
- Peng Z. Lin J. Ye R. Samuel E. L. G. Tour J. M. ACS Appl. Mater. Interfaces. 2015;7:3414–3419. doi: 10.1021/am509065d. [DOI] [PubMed] [Google Scholar]
- Dong Y. Rismiller S. C. Lin J. Carbon. 2016;104:47–55. doi: 10.1016/j.carbon.2016.03.050. [DOI] [Google Scholar]
- Chyan Y. Ye R. Li Y. Singh S. P. Arnusch C. J. Tour J. M. ACS Nano. 2018;12:2176–2183. doi: 10.1021/acsnano.7b08539. [DOI] [PubMed] [Google Scholar]
- Ye R. Q. Chyan Y. Zhang J. B. Li Y. L. Han X. Kittrell C. Tour J. M. Adv. Mater. 2017;29:1702211. doi: 10.1002/adma.201702211. [DOI] [PubMed] [Google Scholar]
- Zhang W. L. Lei Y. J. Ming F. W. Jiang Q. Costa P. M. F. J. Alshareef H. N. Adv. Energy Mater. 2018;8:1600221. [Google Scholar]
- Cançado L. Takai K. Enoki T. Endo M. Kim Y. Mizusaki H. Jorio A. Coelho L. Magalhaes-Paniago R. Pimenta M. J. A. P. L. Appl. Phys. Lett. 2006;88:163106. doi: 10.1063/1.2196057. [DOI] [Google Scholar]
- Gogotsi Y. Simon P. Science. 2011;334:917–918. doi: 10.1126/science.1213003. [DOI] [PubMed] [Google Scholar]
- Strauss V. Marsh K. Kowal M. D. El-Kady M. Kaner R. B. J. A. M. Adv. Mater. 2018;30:1704449. doi: 10.1002/adma.201704449. [DOI] [PubMed] [Google Scholar]
- Wang Z. Shen D. Wu C. Gu S. Green Chem. 2018;20:5031–5057. doi: 10.1039/C8GC01748D. [DOI] [Google Scholar]
- McDonald-Wharry J. S. Manley-Harris M. Pickering K. L. Energy Fuels. 2016;30:7811–7826. doi: 10.1021/acs.energyfuels.6b00917. [DOI] [Google Scholar]
- Ferrari A. C. Meyer J. C. Scardaci V. Casiraghi C. Lazzeri M. Mauri F. Piscanec S. Jiang D. Novoselov K. S. Roth S. Geim A. K. Phys. Rev. Lett. 2006;97:187401. doi: 10.1103/PhysRevLett.97.187401. [DOI] [PubMed] [Google Scholar]
- Kwon S. Yoon Y. Ahn J. Lim H. Kim G. Kim J.-H. Choi K.-B. Lee J. J. C. Carbon. 2018;137:136–145. doi: 10.1016/j.carbon.2018.05.031. [DOI] [Google Scholar]
- Lee S. Jeon S. ACS Sustainable Chem. Eng. 2018;7:2270–2275. doi: 10.1021/acssuschemeng.8b04955. [DOI] [Google Scholar]
- Li L. Zhang J. Peng Z. Li Y. Gao C. Ji Y. Ye R. Kim N. D. Zhong Q. Yang Y. Fei H. Ruan G. Tour J. M. Adv. Mater. 2016;28:838–845. doi: 10.1002/adma.201503333. [DOI] [PubMed] [Google Scholar]
- El-Kady M. F. Kaner R. B. Nat. Commun. 2013;4:1475. doi: 10.1038/ncomms2446. [DOI] [PubMed] [Google Scholar]
- Gao W. Singh N. Song L. Liu Z. Reddy A. L. M. Ci L. J. Vajtai R. Zhang Q. Wei B. Q. Ajayan P. M. Nat. Nanotechnol. 2011;6:496–500. doi: 10.1038/nnano.2011.110. [DOI] [PubMed] [Google Scholar]
- Pech D. Brunet M. Durou H. Huang P. Mochalin V. Gogotsi Y. Taberna P.-L. Simon P. Nat. Nanotechnol. 2010;5:651. doi: 10.1038/nnano.2010.162. [DOI] [PubMed] [Google Scholar]
- Wu Z. S. Parvez K. Feng X. Müllen K. Nat. Commun. 2013;4:2487. doi: 10.1038/ncomms3487. [DOI] [PMC free article] [PubMed] [Google Scholar]
Associated Data
This section collects any data citations, data availability statements, or supplementary materials included in this article.


