
Fig. 2.
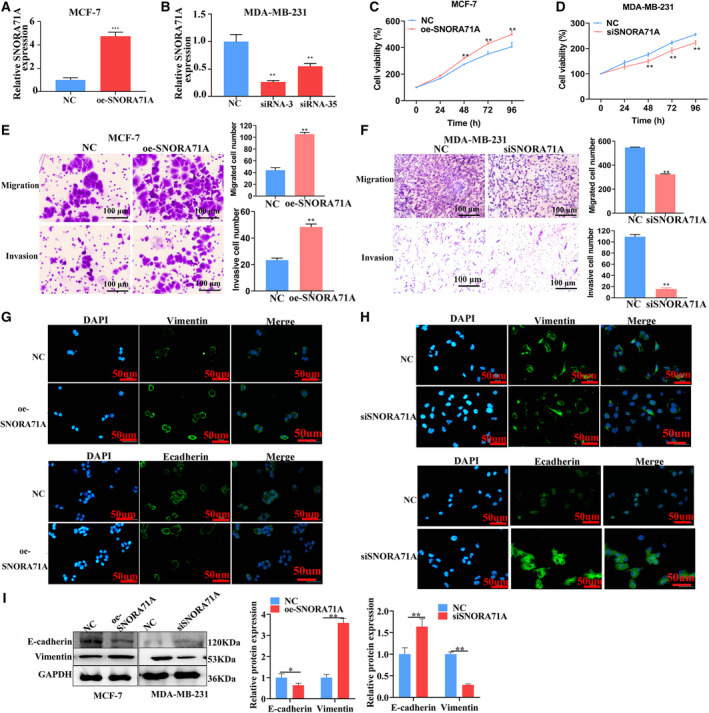
Effect of SNORA71A on breast cancer cells. (A) The overexpression of SNORA71A in MCF‐7 cells was verified by real‐time PCR after transfection for 24 h (n = 3). NC: empty vector; t‐test. Error was defined as SD. (B) The efficiency of SNORA71A silencing in MDA‐MB‐231 cells was verified by real‐time PCR after transfection for 24 h (n = 3). Error was defined as SD. NC: negative control siRNA. The SNORA71A siRNA‐3 was used for next study; t‐test. The Cts of expression upon SNORA71A overexpression and respective NC in MCF‐7 cells were 18 and 20, respectively; and SNORA71A silencing and respective NC were about 21 and 20. (C, D) The effect of SNORA71A on cell proliferation was detected by CCK‐8 assay (n = 6); t‐test. Error was defined as SD. (E, F) The effect of SNORA71A overexpression and silencing on migration and invasion was detected by transwell assay after transfection for 48 h in MCF‐7 and MDA‐MB‐231 cells, respectively. Scale bar = 100 μm; t‐test (n = 3). Error was defined as SD. (G, H) Immunofluorescence displays the expression of EMT marker in MCF‐7 cells (G) and MDA‐MB‐231 cells (H). Scale bar = 50 μm. (I) The effect of SNORA71A on the expression of the EMT marker was detected by western blotting after transfection for 48 h (n = 3). Error was defined as SD. NC for silencing was cells transfected with si‐control, NC for SNORA71A overexpression was cells transfected with empty vector. T‐test. *P < 0.05, **P < 0.01, ***P < 0.001.