
Fig. 3.
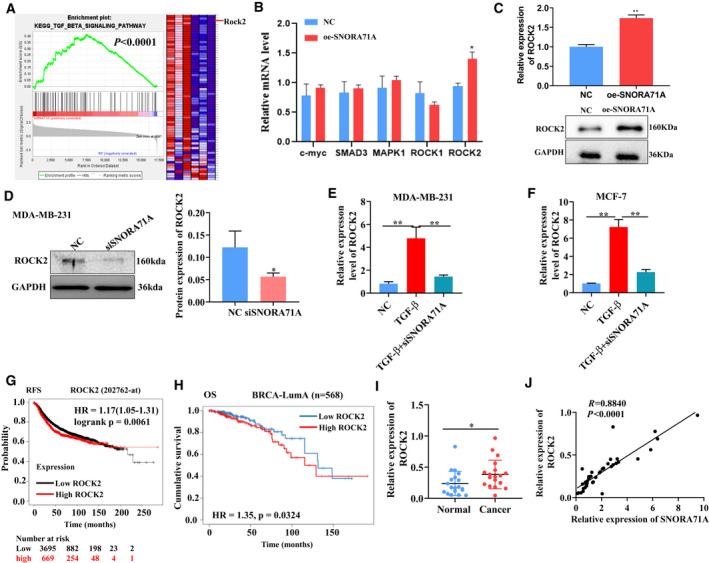
RNA‐seq reveals the genes and pathways related to SNORA71A. (A) Gene Set enrichment analysis (GSEA) for the genes identified by RNA‐seq in DA‐MB‐231 cells transfected with SNORA71A‐overexpressing or empty vector for 24 h. Three biological replicates. The GSEA was performed using all genes (including genes that did not differ significantly), and the red color in the GSEA only represents relatively high expression level, but not represents upregulated. (B) The mRNA expression of genes enriched in TGF‐β signaling was evaluated by real‐time PCR in MDA‐MB‐231 cells. Error was defined as SD. NC: empty vector. oe‐SNORA71A: SNORA71A‐overexpressing plasmid. Cells were transfected with for 24 h. N = 3; t‐test. (C) The expression of ROCK2 was verified by western blot in MDA‐MB‐231 cells (n = 3). Error was defined as SD. NC: empty vector. oe‐SNORA71A: SNORA71A‐overexpressing plasmid. Cells were transfected with for 48 h; t‐test. (D) The expression of ROCK2 protein was measured by western blot in MDA‐MB‐231 cells. NC: cells were transfected by si‐control for 48 h. Error was defined as SD. N = 3, t‐test. *P < 0.05. (E, F) The expression of ROCK2 was measured by real‐time PCR in MDA‐MB‐231 or MCF‐7 cells. NC: cells without any treatment. TGF‐β: cells were only treated with TGF‐β for 48 h, and without si‐control transfected. TGF‐β+siSNORA71A: cells were transfected with siSNORA71A and treated with TGF‐β for 48 h. Error was defined as SD. N = 3, one‐way ANOVA. **P < 0.01. (G) Relationship of ROCK2 expression and recurrence‐free survival (RFS) of breast cancer patients was analyzed by Kaplan–Meier Plotter database (Affy ID: 202762_at). Kaplan–Meier statistical analysis. (H) Relationship of ROCK2 expression and over survival (OS) of BRCA‐LumA patients was analyzed by Timer 2.0 database. Kaplan–Meier statistical analysis. (I) The expression of ROCK2 in breast cancer tissues and normal tissues adjacent to carcinoma was verified by real‐time PCR (n = 19). Error was defined as SD; t‐test. (J) The correlation of SNORA71A and ROCK2 expression as analyzed by real‐time PCR (n = 19). Pearson correlation. *P < 0.05.