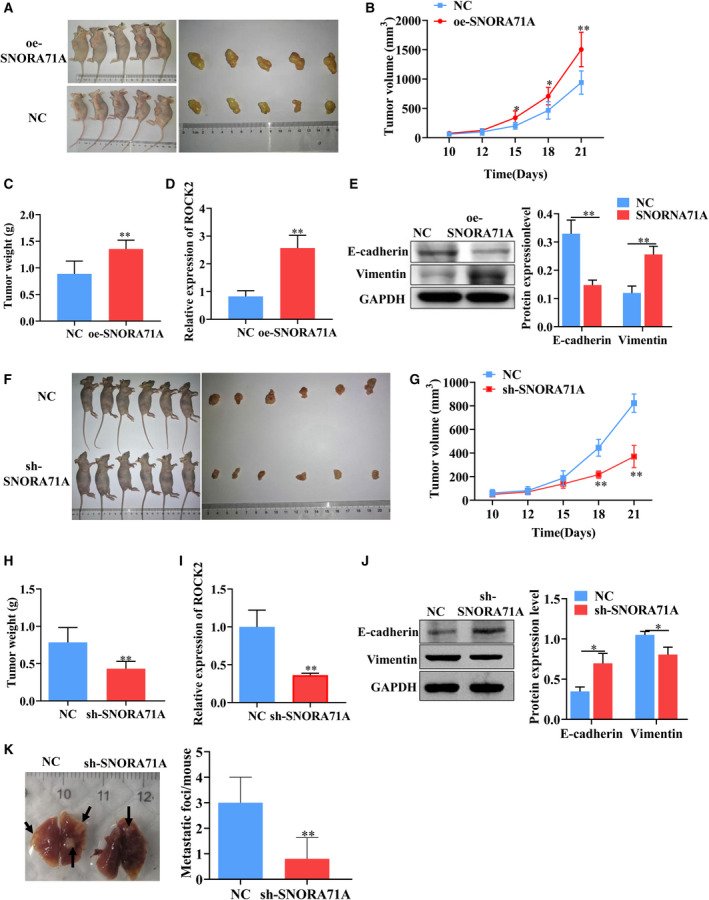
Fig. 7.

SNORA71A promotes tumor growth in vivo. (A) Images show the treated mice and the tumor tissues. Mice were subcutaneously injected with MDA‐MB‐231 cells (n = 5). NC: empty vector; oe‐SNORA71A: SNORA71A‐overexpressing. (B) The tumor volume of mice with SNORA71A overexpression or empty vector. (C) The tumor weight of mice with SNORA71A overexpression or empty vector, t‐test. (D) The mRNA expression of ROCK2 in tumor tissues was detected by real‐time PCR (n = 3). T‐test. (E) The expression of EMT markers was measured by western blotting (n = 3). T‐test. (F) Images of mice subcutaneously injected with MDA‐MB‐231 cells (n = 6). NC: sh‐NC; sh‐SNORA71A: cells stably transfected with SNORA71A shRNA. (G) The tumor volume of mice with sh‐NC or sh‐SNORA71A, t‐test. (H) The tumor weight of mice with sh‐NC or sh‐SNORA71A, t‐test. (I) The mRNA expression of ROCK2 in tumor tissues was detected by real‐time PCR (n = 3), t‐test. (J) The expression of EMT markers was measured by western blotting (n = 3), t‐test. (K) Representative images and the number of lung metastatic nodules of mice. Five biological replicates. Statistical significance was evaluated using t‐test, *P < 0.05, **P < 0.01.
