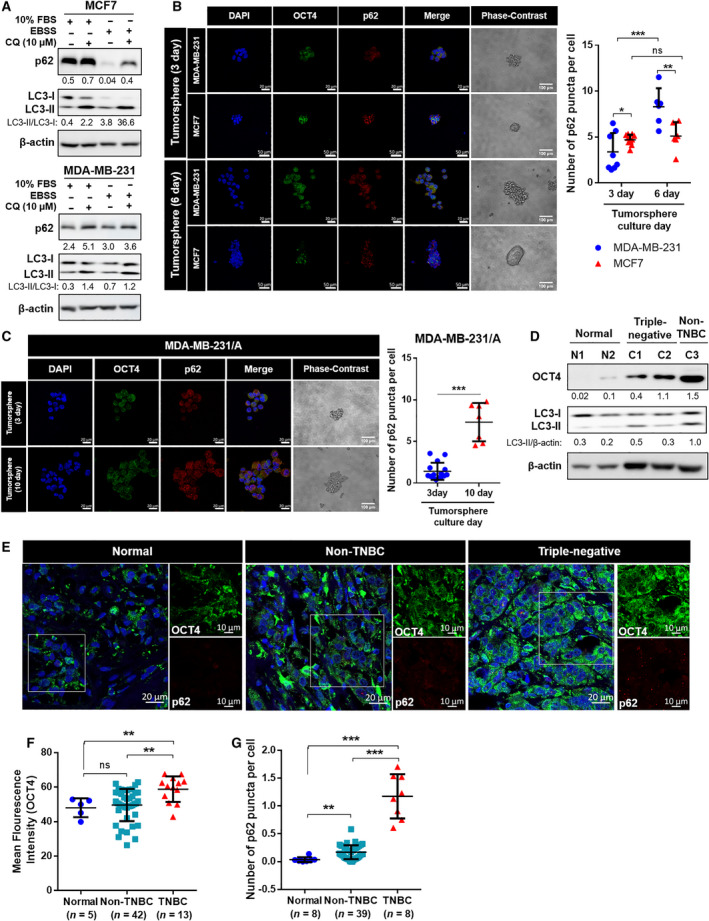
Fig. 1.

The expression of autophagy flux and cancer stemness in breast CSCs. (A) The expression level of LC3 and p62 in breast cancer cells. EBSS, Earle's balanced salt solution; CQ, chloroquine. (B,C) Immunocytochemistry staining of MDA‐MB‐231, MCF7, and MDA‐MB‐231/A tumorspheres for detection of OCT4 and p62 (magnification: ×40) and phase‐contrast images of tumorspheres (magnification: ×20). Nuclei were counterstained with DAPI. The number of p62 puncta was normalized with the number of DAPI‐stained nuclei. Scale bar, 20 μm (fluorescence images of MDA‐MB‐231 and MDA‐MB‐231/A), 50 μm (fluorescence images of MCF7), 100 μm (phase‐contrast images). Data were presented as mean ± SD of three independent experiments. Statistical analyses were performed with one‐tailed student’s t‐test (*P < 0.05, **P < 0.01, ***P < 0.001; ns, nonsignificant difference). (D) The expression levels of OCT4 and LC3 in normal breast and breast cancer tissues. (E) Representative images of immunofluorescence staining of breast cancer tissues (magnification: ×40, zoom: 2.0). The scale bar for magnified images equals 10 μm. Nuclei were counterstained with DAPI. Scale bar, 20 μm. (F) Mean fluorescence intensity of OCT4 in normal breast (n = 5), non‐TNBC (luminal and HER2; n = 42) and TNBC tissues (n = 13). (G) The expression level of p62 in normal breast (n = 8), non‐TNBC (n = 39), and TNBC tissues (n = 8). The numbers of p62 puncta were normalized with the number of DAPI‐stained nuclei. (F,G) Each dot represents one patient and intensity value of about 150 cells was measured on average per patient. The normal tissues used in the experiment are not paired with cancer tissues. Data were presented as mean ± SD. Statistical analyses were performed with one‐tailed Student’s t‐test (**P < 0.01, ***P < 0.001; ns, nonsignificant difference).
