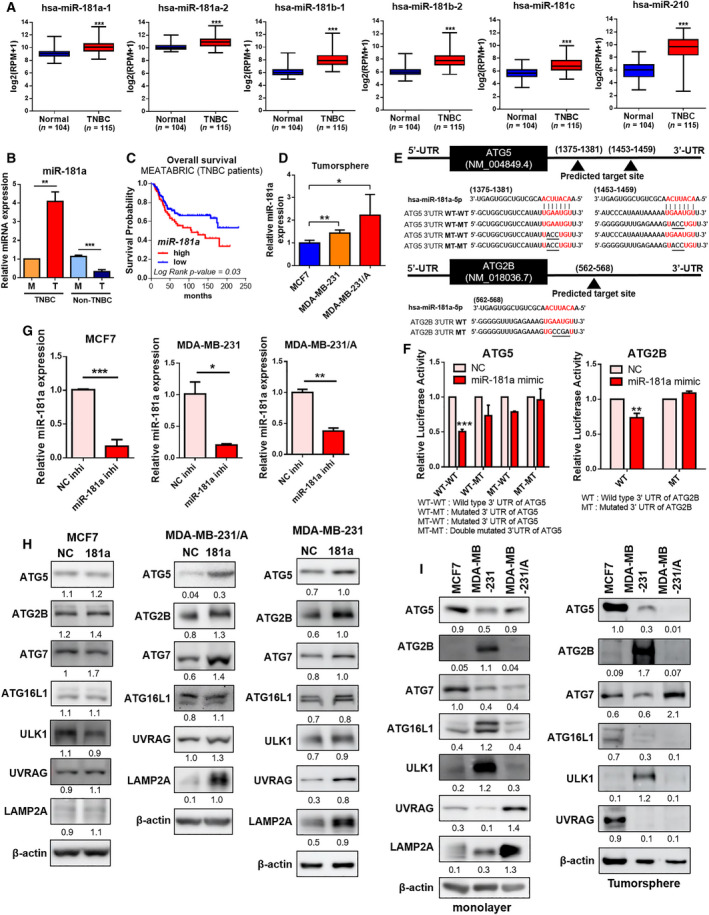
Fig. 2.

miR‐181a is upregulated in TNBC CSCs and directly targets autophagy genes. (A) The expression levels of six miRNAs between TNBC (n = 115) and normal tissues (n = 104). MOBCdb was used to confirm expression levels. Statistical analyses were performed with one‐tailed Student’s t‐test (***P < 0.001). (B) The expression levels of miR‐181a in TNBC (MDA‐MB‐231) and non‐TNBC (MCF7) cells. M, monolayer; T, tumorsphere. Data were presented as mean ± SD of three independent experiments. Statistical analyses were performed with one‐tailed Student’s t‐test (**P < 0.01, ***P < 0.001). (C) Kaplan–Meier analysis of METABRIC datasets showing overall survival of TNBC patients. P‐value was calculated using the log‐rank test. Patients were stratified into ‘low (blue)’ and ‘high (red)’ miR‐181a expression groups based on the auto‐selected best cut‐off. (D) miR‐181a expression level in breast cancer tumorspheres. Data were presented as mean ± SD of three independent experiments. Statistical analyses were performed with one‐tailed Student’s t‐test (*P < 0.05, **P < 0.01). (E) The sequence alignment of miR‐181a and the 3′ UTRs of ATG5 and ATG2B containing miRNA‐binding sites. (F) Luciferase activities of the wild‐type or mutant 3′ UTR constructs of ATG5 and ATG2B in HEK293T cells 24–48 h after transfection with miR‐181a mimic or negative control. NC, negative control mimic. Data were presented as mean ± SD of three independent experiments. Statistical analyses were performed with one‐tailed Student’s t‐test (**P < 0.01, ***P < 0.001). (G) qRT‐PCR analysis showing the miR‐181a expression level in breast cancer cells after transfection with miR‐181a inhibitor or negative control. NC inhi, negative control inhibitor; miR‐181a inhi, miR‐181a inhibitor. Data of MCF7 were presented as mean ± SD of five independent experiments. Data of MDA‐MB‐231 and MDA‐MB‐231/A were presented as mean ± SD of three independent experiments. Statistical analyses were performed with one‐tailed Student’s t‐test (*P < 0.05, **P < 0.01, ***P < 0.001). (H) Protein expression levels of autophagy genes in breast cancer cells transfected with negative control (NC) or miR‐181a inhibitor (181a). (I) Protein expression levels of autophagy genes in breast cancer cells grown in monolayer or tumorspheres.
