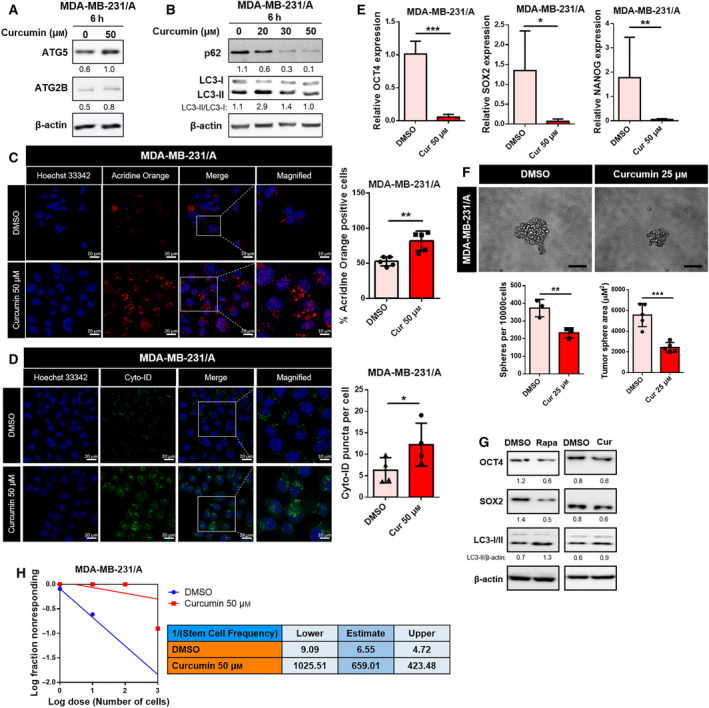
Fig. 4.

Recovery of autophagy by curcumin inhibits cancer stemness in TNBC. (A) Protein levels of ATG5 and ATG2B in curcumin‐treated MDA‐MB‐231/A cells. (B) Treatment of MDA‐MB‐231/A cells with different concentrations of curcumin. (C) Confocal microscopy of acridine orange staining in curcumin‐treated MDA‐MB‐231/A cells (left, magnification: ×40, zoom: 2.0). The scale bar for magnified images equals 10 μm. Nuclei were counterstained with Hoechst 33342. Scale bar, 20 μm. The percentage of MDA‐MB‐231/A cells containing acridine orange puncta is shown (right). The number of nuclei was used to normalize the values. Data were presented as mean ± SD. Statistical analyses were performed with one‐tailed Student’s t‐test (**P < 0.01). (D) Confocal microscopy of curcumin‐treated MDA‐MB‐231/A cells stained with Cyto‐ID dye (left, magnification: ×40, zoom: 2.0). The scale bar for magnified images equals 10 μm. Nuclei were counterstained with Hoechst 33342. Scale bar, 20 μm. The number of Cyto‐ID puncta was normalized with the number of nuclei (right). Data were presented as mean ± SD. Statistical analyses were performed with one‐tailed Student’s t‐test (*P < 0.05). (E) mRNA expression of cancer stemness markers in curcumin‐treated MDA‐MB‐231/A cells. Data were presented as mean ± SD of three independent experiments. Statistical analyses were performed with one‐tailed Student’s t‐test (*P < 0.05, **P < 0.01, ***P < 0.001). (F) Representative images of MDA‐MB‐231/A tumorspheres treated with curcumin (left, magnification: ×20). Scale bar, 100 μm. The number and sizes of tumorspheres were quantified (below). Data were presented as mean ± SD. Statistical analyses were performed with one‐tailed Student’s t‐test (**P < 0.01, ***P < 0.001). (G) Protein levels of OCT4, SOX2, and LC3 in rapamycin or curcumin‐treated MDA‐MB‐231/A cells. (H) Limiting dilution assay performed on MDA‐MB‐231/A cells treated with curcumin. Stem cell frequency was calculated using extreme limiting dilution assay analysis.
