Fig. 1.

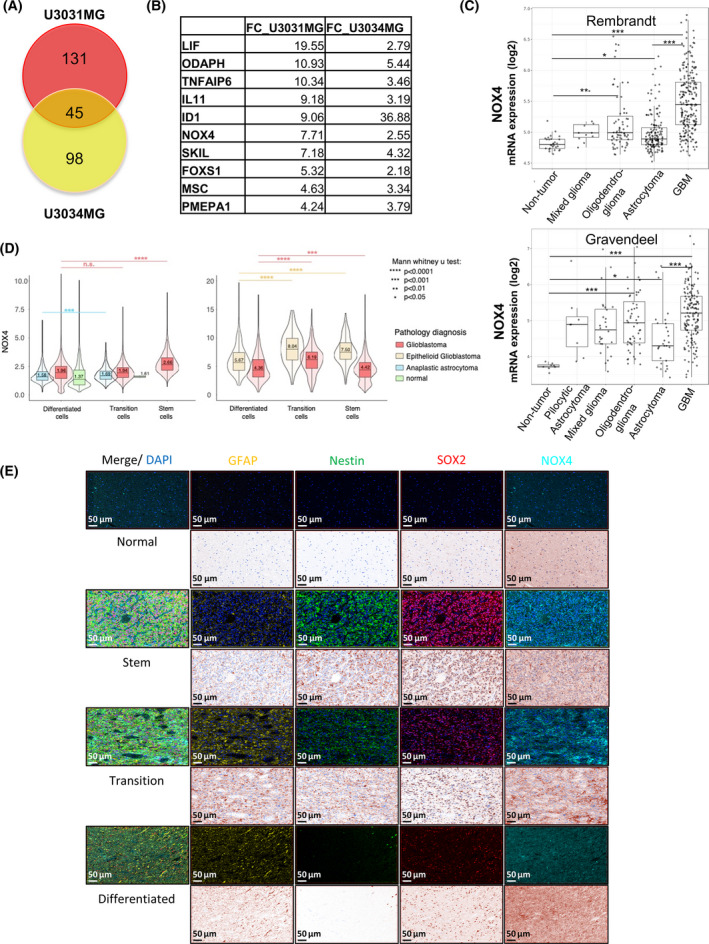
NOX4 is upregulated by TGFβ1 in Glioblastoma. (A) Venn diagram illustration of gene expression similarity between upregulated genes by TGFβ1 in U3031MG cells and U3034MG cells after 24 h of treatment. (B) Table indicating the fold‐change values of the common top 10 upregulated genes by TGFβ1 in both cell lines. (A, B) Data are extracted from the HTA2 Affymetrix Platform transcriptomic analysis performed in U3031MG and U3034MG cells treated with or without TGFβ1 in triplicate. (C) NOX4 mRNA expression in different types of glioma cells relative to non‐tumour cells using different databases (REMBRANDT, top; Gravendeel, bottom), t‐test with Bonferroni correction is shown in the pairwise comparisons between the indicated groups, significant differences at *P < 0.05, **P < 0.01, ***P < 0.001. (D) NOX4 expression per cell in normal, glioblastoma and anaplastic astrocytoma tissue samples from two different tissue microarrays (colour‐coded) plotted as a function of the three marker proteins expression in the same cell. Cells were classified to three groups, GBM_diff (GFAPhigh/Nestinlow/SOX2low), GBM_transition (GFAPmedium/Nestinmedium/SOX2medium) and GBM_Stem (GFAPlow/Nestinhigh/SOX2high). Statistical comparison indicates ***P < 0.001, ****P < 0.0001, statistics: Mann–Whitney U test. (E) Representative images displaying staining of the four proteins, NOX4/Nestin/SOX2/GFAP, in normal brain (four cases in duplicate) and glioblastoma tissue samples (36 cases in duplicate), scale bar indicates 50 µm.
