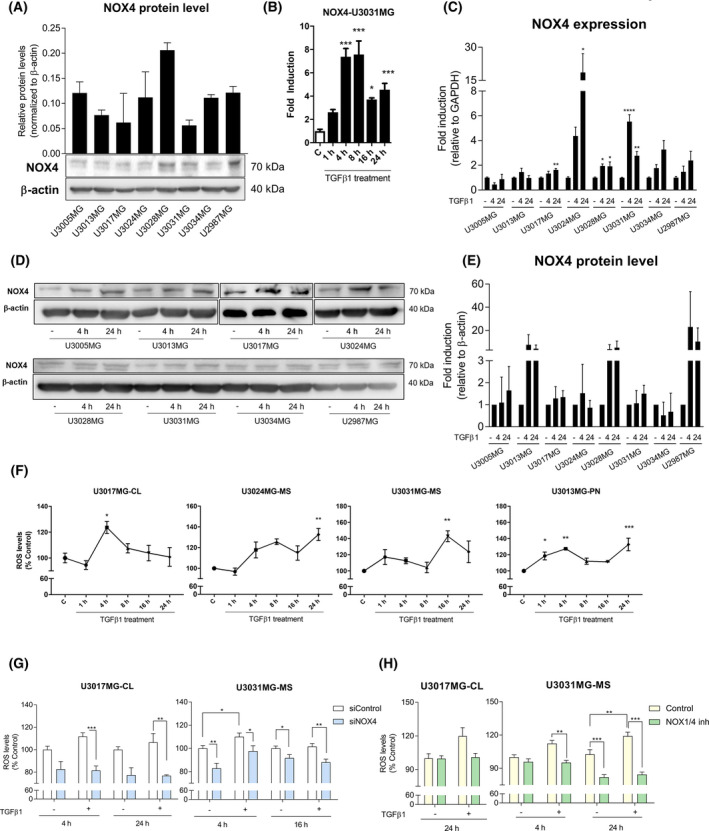
Fig. 2.

TGFβ1 increases the reactive species of oxygen in a NOX4‐dependent manner. (A) Expression panel of NOX4 in different patient‐derived glioblastoma stem cells lines at the protein level, data represent the mean ± SEM (n = 2 independent experiment). (B) Time course of NOX4 mRNA expression levels analysed by qPCR in U3031MG cell line upon TGFβ1 treatment, representative experiment of 2; statistics: one‐way ANOVA test, Tukey’s multiple comparisons test. (C) NOX4 mRNA expression levels analysed by qPCR in different cell lines and time points upon TGFβ1 stimulation. Data represent the mean ± SEM (n = 3 independent experiments); statistics: one‐way ANOVA test, Dunnett's multiple comparisons test; (D) representative immunoblot of NOX4 protein in different cell lines upon TGFβ1 stimulation, β‐actin was used as loading control, (E) the quantification of two experiments is plotted as mean ± SEM; statistics: one‐way ANOVA test, Dunnett's multiple comparisons test. (F) Time course of ROS production upon TGFβ1 treatment in different cell lines. Data represent the mean ± SEM (n = 2 independent experiments, each with biological triplicate); statistics: one‐way ANOVA test, Tukey’s multiple comparisons test. (G) ROS production upon TGFβ1 stimulation in control (siControl) and NOX4‐silenced (siNOX4, pool of four siRNA sequences) cells in different cell lines and time points. Data represent the mean ± SEM (n = 3 independent experiments and each with biological triplicate); statistics: two‐way ANOVA test, Bonferroni posttests. (H) ROS production upon TGFβ1 stimulation in the presence or absence of NOX1/4 inhibitor (GKT137831, 20 µm) in different GSC cells and time points. Data represent the mean ± SEM (n = 2 independent experiments, each with biological triplicate); statistics: two‐way ANOVA test, Sidak’s multiple comparison. In the cell line names, CL stands for classical subtype, PN stands for proneural subtype and MS for mesenchymal subtype of GBM. Statistical comparison indicates *P < 0.05, **P < 0.01, ***P < 0.001, ****P < 0.0001.
