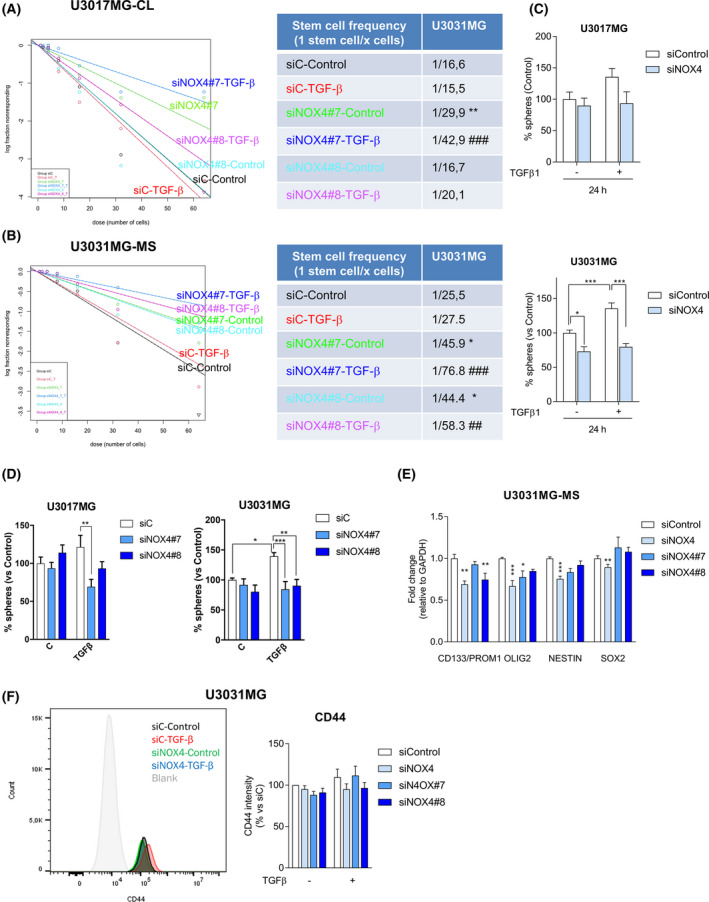
Fig. 5.

NOX4 regulates GSC self‐renewal capacity induced by TGFβ1. (A, B) U3017MG and U3031MG cells were transiently transfected with control (siControl), or two different siRNA sequences against NOX4 (siN4#7, siN4#8) and stimulated with TGFβ1, when indicated, for 6 days. Limiting dilution neurosphere assay was performed, analysed by ELDA showing stem cell frequencies. The table presents the stem cell frequency (n = 5 with 7–12 replicates each for a; n = 3 with 6 replicates in B); statistics: Chi square. (C, D) U3017MG and U3031MG cells were transiently transfected with control (siControl), NOX4 (siNOX4, pool of four siRNA sequences) siRNAs or using two different siRNA sequences against NOX4 (siN4#7, siN4#8) and stimulated with TGFβ1, when indicated, for 6 days, when the number of spheres were counted, data represent mean ± SEM (n = 2 for U3017MG, n = 6 for U3031MG in D, n = 3 for both cells, all experiments with four biological replicates); statistics: two‐way ANOVA test, Sidak’s multiple comparison. (E) U3031MG cells were transiently transfected with control (siControl) or NOX4 siRNAs (siNOX4, pool of four siRNA sequences) or using two different siRNA sequences against NOX4 (siN4#7, siN4#8) for 5 days; the expression levels of mRNA of the indicated genes were analysed by qPCR. Data represent the mean ± SEM (n = 2–4 independent experiments and each with technical triplicate); statistics: two‐Way ANOVA test, Tukey’s multiple comparison. (F). Flow cytometry analysis of CD44 surface marker expression in U3031MG transiently transfected with control (siControl), NOX4 (siNOX4, pool of four siRNA sequences) siRNAs or using two different siRNA sequences against NOX4 (siN4#7, siN4#8) and stimulated with TGFβ1 for 24 h, left shows a representative FACS profile, the graph right represents mean ± SEM (n = 4); statistics: two‐way ANOVA test, Tukey’s multiple comparison. (A–F) Statistical comparison indicates *P < 0.05, **P < 0.01, ***P < 0.001 vs siControl; ## P < 0.01, ### P < 0.001 vs siC‐TGFβ.
