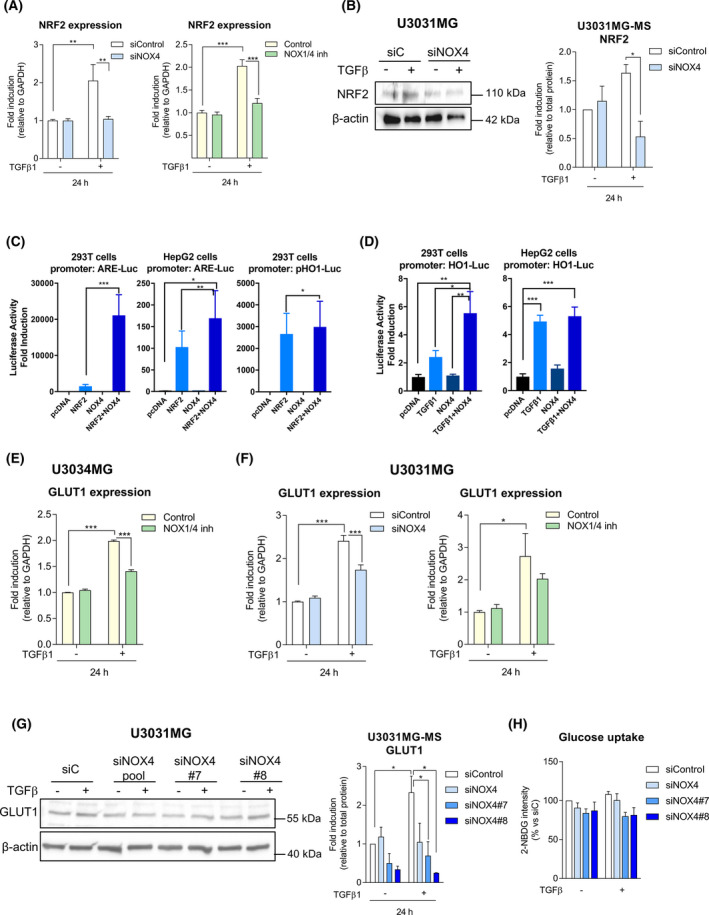
Fig. 6.

TGF‐β regulates NRF2 in an NOX4‐dependent manner. (A) NRF2 mRNA expression levels analysed by qPCR: U3031MG cells were transiently transfected with control (siControl) or NOX4 (siNOX4, pool of four siRNA sequences) siRNAs and stimulated with TGFβ1 for 24 h (left), or NOX4 function was inhibited by NOX1/4 inhibitor (right); data represent the mean ± SEM (n = 2 independent experiments and each with technical triplicate); statistics: two‐way ANOVA test, Tukey’s multiple comparison. (B) U3031MG cells were transiently transfected with control (siControl) or NOX4 (siNOX4, pool of 4 siRNA sequences) siRNAs and stimulated with TGFβ1 for 24 h, immunoblot of NRF2, β‐actin is used as a loading control; a representative experiment is shown and the quantification of four experiments is plotted as mean ± SEM; statistics: two‐Way ANOVA test, Sidak’s multiple comparison (C) NRF2‐responsive ARE‐luciferase reporter assay in 293T and HepG2 cells, NRF2‐responsive HO1‐luciferase reporter assay in 293T cells, data represent the mean ± SEM (n = 2–3 independent experiments and each with technical quadruplicate); statistics: one‐way ANOVA test, Tukey’s multiple comparison. (D) NRF2‐responsive HO1‐luciferase reporter assay in 293T cells and HepG2 cells; cells were transiently transfected with NOX4 and stimulated with TGFβ1 or 24 h prior to the measurement of luminescence, data represent the mean ± SEM (n = 2 independent experiments and each with technical quadruplicate); statistics: one‐way ANOVA test, Tukey’s multiple comparison. (E) GLUT1 mRNA expression levels analysed by qPCR: U3034MG cells were stimulated with TGFβ1 for 24 h in the presence or absence of the NOX1/4 inhibitor, data represent the mean ± SEM (n = 2 independent experiments, each with technical triplicate); statistics: one‐way ANOVA test, Tukey’s multiple comparison. (F) GLUT1 mRNA expression levels analysed by qPCR: U3031MG cells were transiently transfected with control (siControl) or NOX4 (siNOX4, pool of four siRNA sequences) siRNAs and stimulated with TGFβ1 for 24 h (left); U3031MG cells were stimulated with TGFβ1 for 24 h in the presence or absence of the NOX1/4 inhibitor (right); data represent the mean ± SEM (n = 2–3 independent experiments and each with technical triplicate), statistics: one‐way ANOVA test, Tukey’s multiple comparison. (G) U3031MG cells were transiently transfected with control (siControl), NOX4 (siNOX4, pool of four siRNA sequences) siRNAs or using two different siRNA sequences against NOX4 (siN4#7, siN4#8) and stimulated with TGFβ1 for 24 h; immunoblot of GLUT1, β‐actin is used as a loading control. (B, G) Quantification of immunoblot data using the densitometric analysis of each protein, normalised with total protein using Stain‐Free precast gels using image lab™ software (Bio‐Rad, Sundbyberg, Sweden); data represent mean ± SEM (n = 3–4 independent experiments), statistics: two‐way ANOVA test, Sidak’s multiple comparison. (H) Glucose uptake in U3031MG cells were transiently transfected with control (siControl), or NOX4 siRNAs, a pool of four sequences (siNOX4) or using two different siRNA sequences against NOX4 (siN4#7, siN4#8) and stimulated with TGFβ1 for 24 h. Data represent the mean ± SEM (n = 6 independent experiments for siNOX4, n = 2 for individual siRNA sequences); statistics: one‐way ANOVA test, Dunnett’s multiple comparison. (A–H) Statistical comparison indicates *P < 0.05, **P < 0.01, ***P < 0.001.
