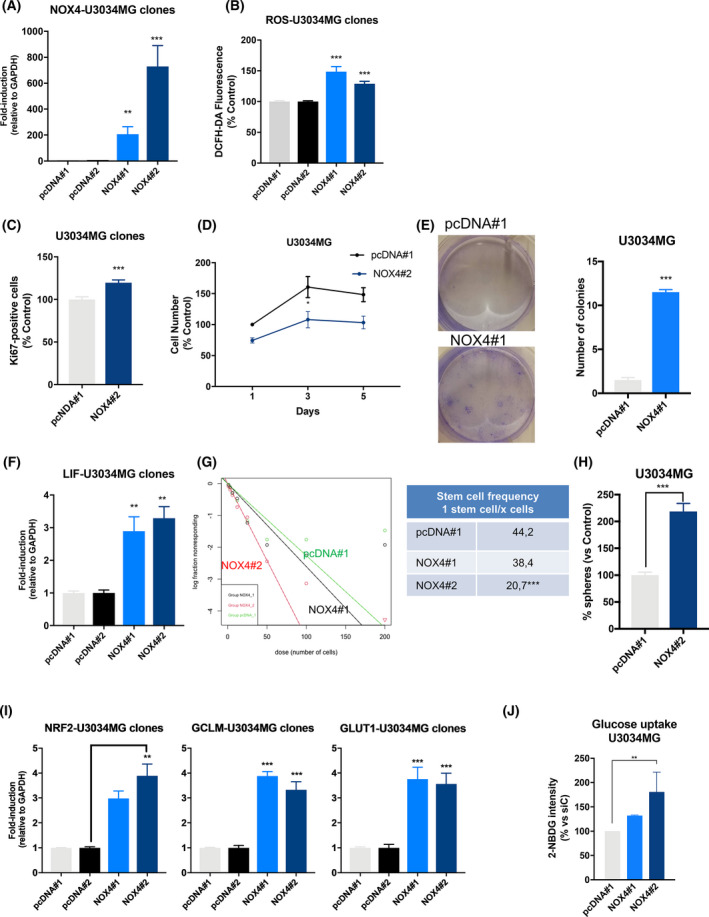
Fig. 7.

NOX4 overexpression mimics TGFβ effects in GSCs. U3034MG cells stably overexpressing the empty vector pcDNA or pcDNA‐V5‐NOX4, pool#1 and pool#2 were analysed. (A, F, I) mRNA expression levels analysed by qPCR of the indicated genes, data represent the mean ± SEM (n = 3 independent experiments and each with technical triplicate), statistics: one‐way ANOVA test, Dunnett’s multiple comparison. (B) Basal ROS production in the different indicated clones after 48 h of being seeded. Data represent the mean ± SEM (n = 3 independent experiments and each with biological triplicate), statistics: one‐way ANOVA test, Tukey’s multiple comparison. (C) Quantification of Ki67‐positive cells with respect to the control. Data represent the mean ± SEM (n = 3 independent experiment, 10 images per condition and experiments were quantified); statistics: two‐way ANOVA test, Bonferroni’s multiple comparison. (D) Cell viability was assayed by MTS at the indicated times, data represent the mean ± SEM (n = 3 independent experiment with four biological replicates); statistics: two‐way ANOVA test, Sidak’s multiple comparison. (E) Colony formation during 21 days, left panel shows representative images, right panel shows quantification. Data represent the mean ± SEM (n = 2 independent experiments with three biological replicates); statistics: unpaired t‐test. (G) Limiting dilution neurosphere assay was performed in U3034MG clones for 6 days, analysed by ELDA, the tables show the stem cell frequency and the statistical differences between both groups (n = 5 with 6–12 replicates each); statistics: Chi square. (H) Number of spheres was counted 6 days after seeding, when the number of spheres were counted, data represent mean ± SEM (n = 4 with four biological replicates); statistics: unpaired t‐test. (J) Glucose uptake was measured by flow cytometry; data represent mean ± SEM (n = 3 independent experiments); statistics: one‐way ANOVA test, Tukey’s multiple comparison. (A–J) Statistical comparison indicates *P < 0.05, **P < 0.01, ***P < 0.001.
