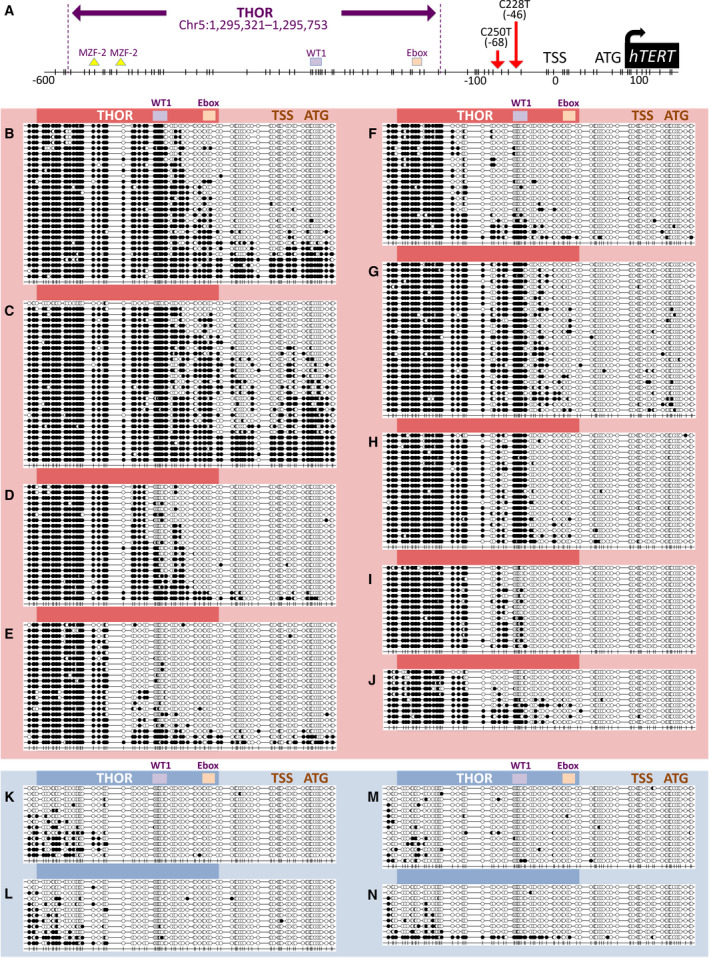
Fig. 2.

hTERT gene promoter methylation including THOR in CTCL cells and healthy controls. (A) hTERT gene promoter including THOR (Chr5:1 295 321–1 295 753;GRCh37/hg19) containing 52 CpG represented each by a vertical dash. (B–N) Methylation profiles of CTCL cells (red) and controls (blue): Full black dots represent methylated CpGs, whereas empty dots represent unmethylated CpGs. For CTCL cell lines: MyLa is represented in (B), HuT78 in (C), Mac1 in (D), Mac2A in (E), and Mac2B in (F). For SS PDC: PDC 1 is represented in (G), PDC 2 in (H), PDC 3 in (I), and PDC 4 in (J). Healthy CD4+ controls: Two pools are represented in (K) and (L). Normal stem/progenitor cells: Two pools of normal CD34+ cells are represented in (M) and (N). n = three independent experiments.
