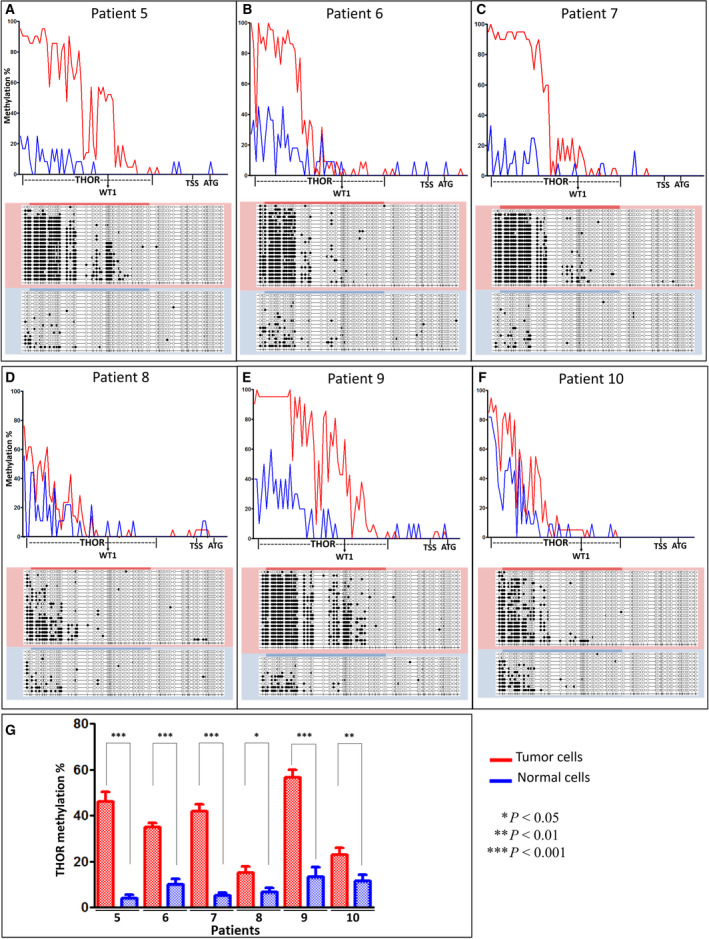
Fig. 3.

hTERT gene promoter methylation including THOR in Sézary syndrome patient cells. Graphs (A) to (F) showing the difference between methylation profiles of tumor cells (red) and normal cells (blue), in patient 5 (A), patient 6 (B), patient 7 (C), patient 8 (D), patient 9 (E), and patient 10 (F). Chart (G) showing THOR methylation levels in tumor (red) and normal (blue) cells in each of the six SS patients' cells (±SEM). Statistical significances were determined by t‐test. THOR, TERT hypermethylated oncogenic region.
