
Fig. 5.
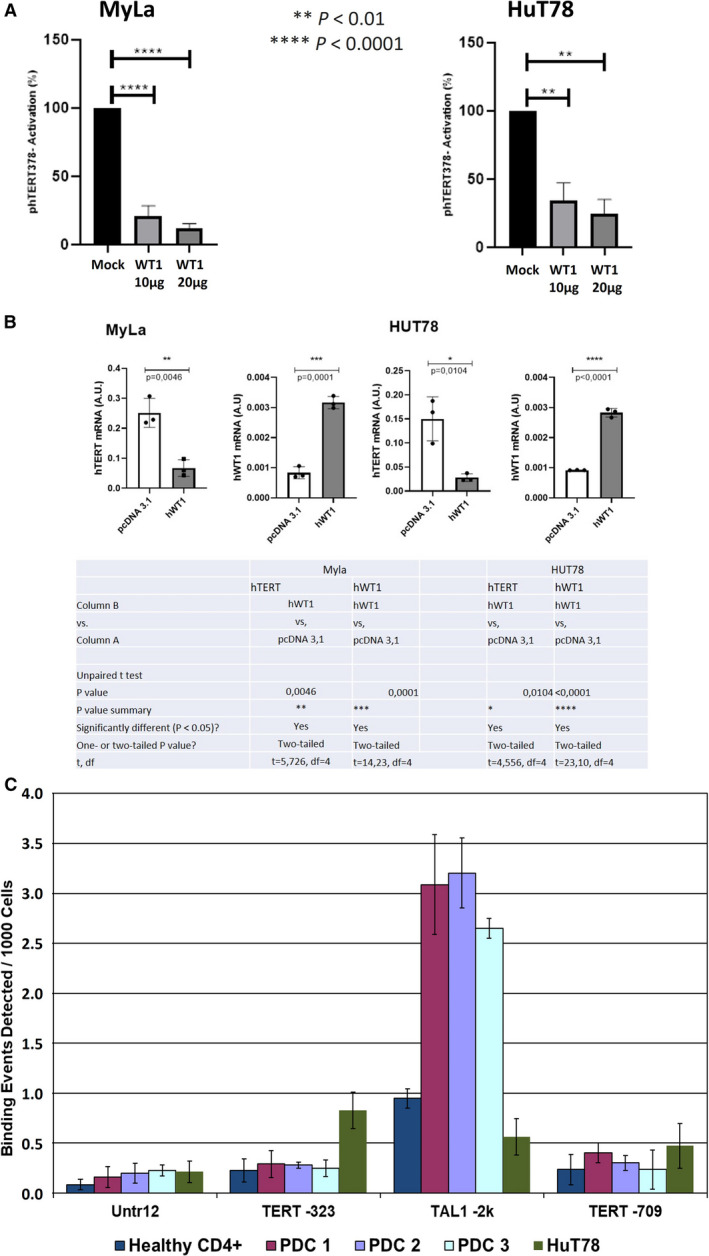
Effect of the transcription factor WT1 on hTERT promoter in CTCL. Graph (A) presents the results of luciferase assay showing the effect of empty vector (mock), 10 and 20 µg of WT1 on hTERT promoter activation in HuT78 and MyLa cell lines. Graph and table (B) show the significant decrease in hTERT mRNA expression after the overexpression of WT1 in MyLa and HuT78. Graph (C) shows the results of ChIP‐qPCR using a WT1 antibody targeting the TERT‐323 region (region of interest) in SS PDCs 1, 2, and 3, HuT78, a SS cell line, and healthy CD4+ (control), along with a negative control (Untr12) region, and two positive control regions (TAL1‐2k and TERT‐709). The results for the TAL1‐2k region confirm the efficacy of the used WT1 primer. Statistical significances were determined by t‐test. n = three independent experiments. SS PDCs, Sézary syndrome patient‐derived cells; df, degrees of freedom.