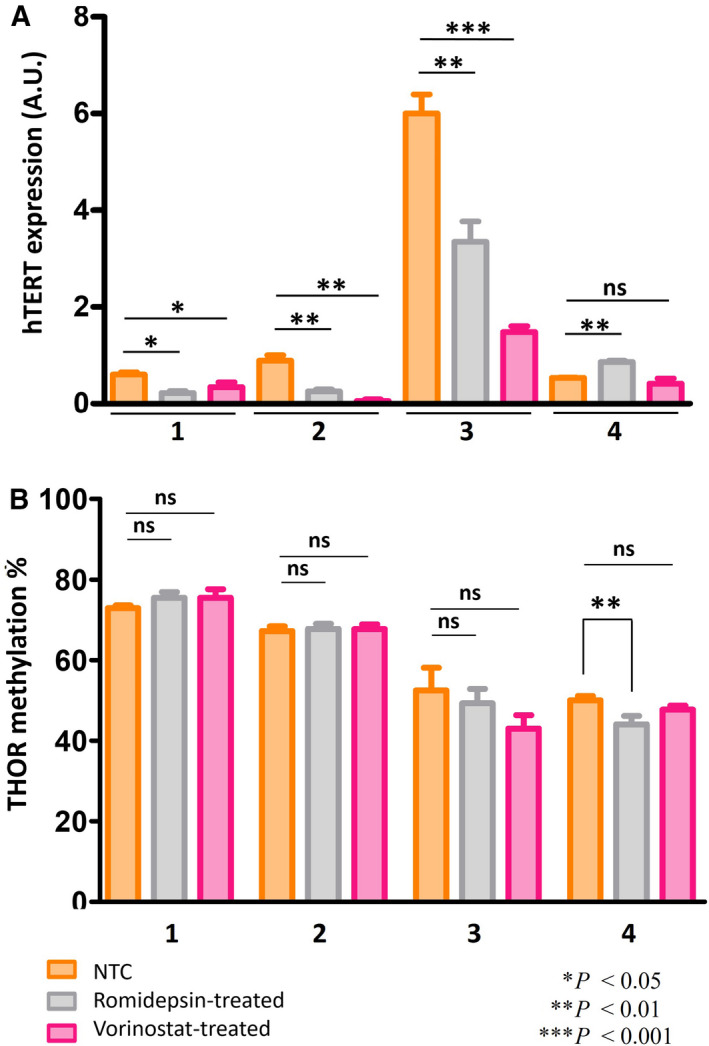
Fig. 6.

HDACi treatments in Sézary syndrome patient‐derived cells. Graph (A) shows hTERT expression in NTC, romidepsin, and vorinostat‐treated cells. Graph (B) shows THOR methylation % in NTC, romidepsin, and vorinostat‐treated cells (±SEM). Statistical significances were determined by t‐test. n = three independent experiments. HDACi, histone deacetylase inhibitors; NTC, nontreated cells.
