
FIGURE 5.
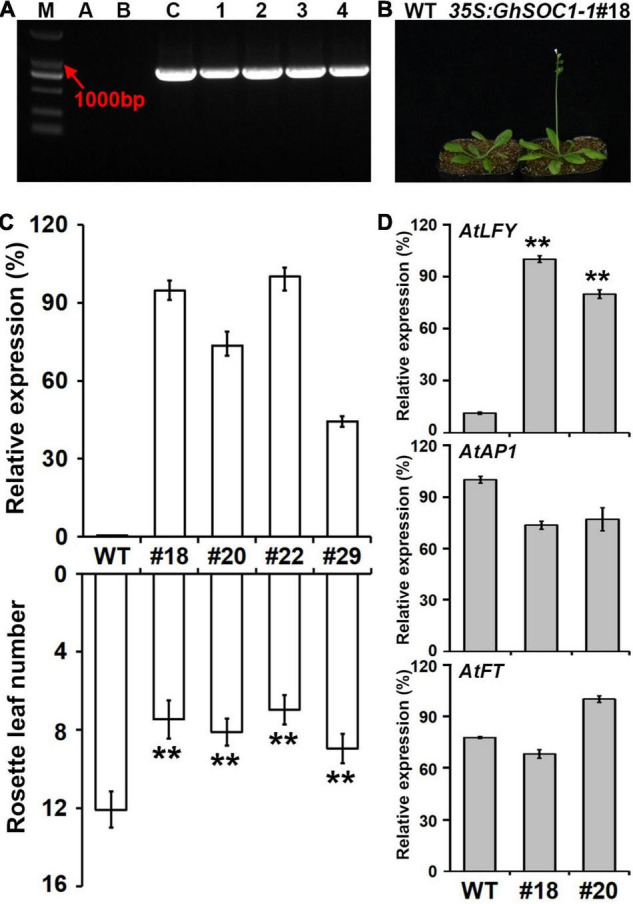
Overexpression of GhSOC1-1 promotes flowering of Arabidopsis. (A) Genotype verification of positive plants in T1 generation. M, DNA molecular weight marker DL 2000; A-C, water control, WT control and positive control; 1-4, PCR detection of positive plants. (B) Phenotype of T3 generation line. (C) Relative expression of GhSOC1-1 and statistics of flowering time in transgenic lines and wild-type Arabidopsis. Asterisks indicate statistically significant differences according to Student’s t-test (**P < 0.01). (D) Expression of AtLFY, AtAP1, and AtFT in transgenic and wild-type Arabidopsis. The expression is normalized to AtTUB2 and the maximum expression is set as 100%. Error bars represent the standard deviations of three biological replicates.