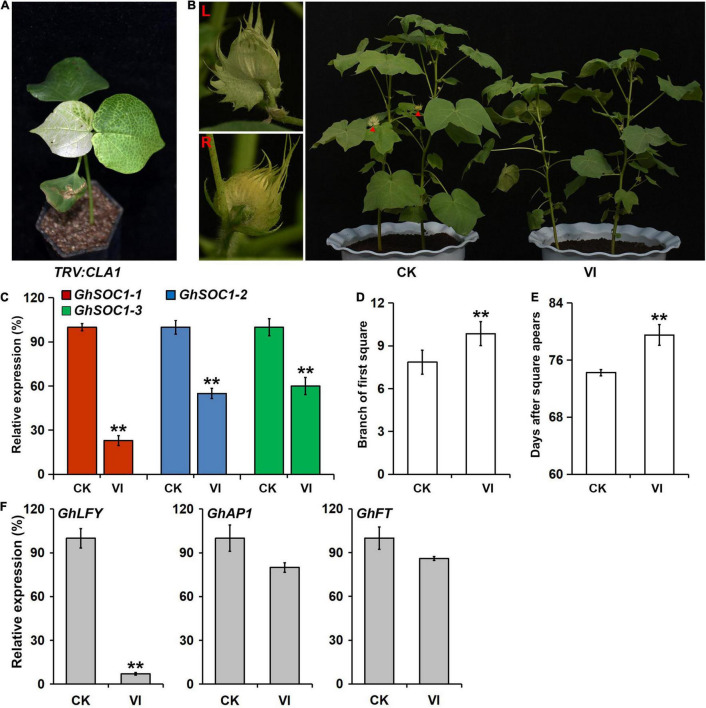
FIGURE 6.
VIGS of GhSOC1s in G. hirsutum delays flowering time. (A) Albino phenotype of TRV:CLA1 as a control. (B) Delayed flowering phenotype of VIGS plants. Red triangles point the flower buds displayed in the left. CK, empty vector control; VI, silence plants. (C) Detection of the efficiency of gene silencing. The expression was normalized to GhHIS and the maximum expression is set as 100%. Error bars represent the standard deviations of three biological replicates. (D,E) Maturity traits of VIGS plants in branch of first square (D) and days from sowing until square appears (E). Asterisks indicate statistically significant differences among 15 individuals according to Student’s t-test (**P < 0.01). (F) Expression of GhLFY, GhAP1, and GhFT in Silencing and control plants. The expression is normalized to GhHIS and the maximum expression is set as 100%. Error bars represent the standard deviations of three biological replicates.

