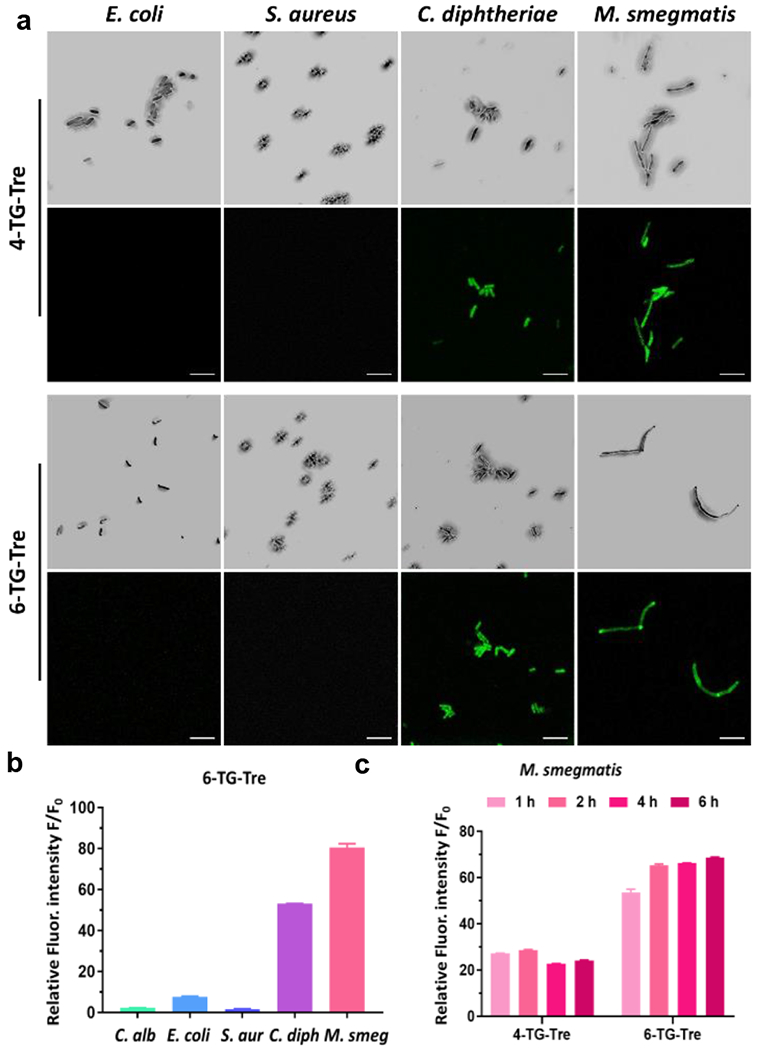
Figure 2.

Fluorescence analysis of different species of bacteria and fungi labeled with 4-TG-Tre or 6-TG-Tre. (a) Confocal images of freshly cultured E. coli (TOP10), S. aureus, C. diphtheriae and M. smegmatis stained with 50 μM of 4-TG-Tre and 6-TG-Tre in PBS for 2 h at 37 °C. For each set of images, the top row = bright field; bottom row = green fluorescence, 63x/oil, Ex-490 nm/Em-520 nm. Scale bars indicate 5 μm. (b-c) Green fluorescence activated flow cytometry analysis of (b) freshly cultured C. albicans, E. coli (TOP10), S. aureus, C. diphtheriae and M. smegmatis with 50 μM of 6-TG-Tre in PBS at 37 °C for 2h; or (c) M. smegmatis stained with 50 μM of 4-TG-Tre and 6-TG-Tre in PBS at 37 °C for 1, 2, 4, 6 h. The autofluorescence of unlabeled bacteria (F0) was utilized to normalize the intensity. N=3, error bars represent standard deviation.
