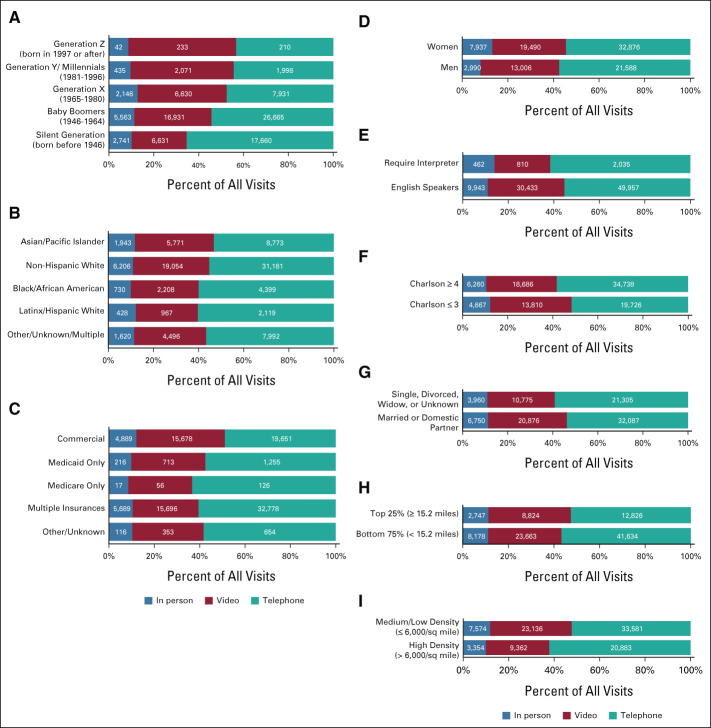
FIG 1.
Proportions and absolute numbers of office, telephone, and video visits between March 19, 2021, and September 30, 2021, by (A) age group, (B) race and ethnicity, (C) insurance type, (D) sex, (E) language/require interpreter, (F) Charlson comorbidity index, (G) marital status, (H) driving distance to clinic, and (I) clinic city population density. Missing/unknown values, when present, were grouped with other categories as described in the figure. Comparisons were made using Pearson's χ2 statistic. P < .01 for all comparisons.

