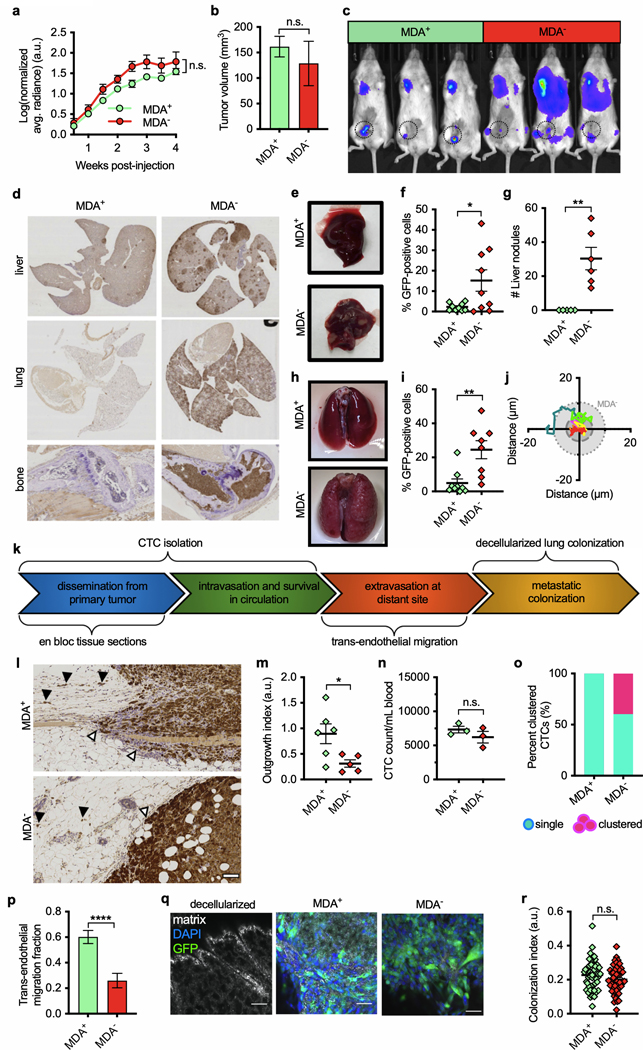
Figure 2.
Phenotypically sorted subpopulations show differential metastatic potentials in vivo. a) Primary tumor growth quantified by bioluminescence imaging using log(normalized average radiance) (n = 4). b) Primary tumor volume as measured by calipers (n = 3). c) Endpoint image showing metastasis via bioluminescence imaging. d) Representative images of anti-GFP immunohistochemical (IHC) staining of lung, liver, and bone samples counterstained with hematoxylin. e) Representative images of livers collected at study endpoint and f) quantification of percentage of GFP-positive cells in liver anti-GFP IHC sections (n = 9). g) Quantification of metastatic liver nodules at study endpoint (n = 5,6). h) Representative images of lungs at study endpoint. i) Quantification of GFP-positive cells measured via IHC of lung histological sections (n = 8,9). j) Representative migration traces of MDA− cells seeded in 1.5 mg/mL collagen after isolation from lungs of mice at 4 weeks post injection. Dark grey dashed line represents average distance migrated from MDA− cells in vitro with light grey dotted line representing standard deviation. k) Schematic of stages of the metastatic cascade assessed by each experiment. l) Anti-GFP IHC staining of en bloc tumor sections; white arrow indicates local spread at the primary tumor periphery; black arrows indicate cell migration into the stroma. m) Quantification of outgrowth index to assess local dissemination in en bloc histology (n = 6,5). n) Quantification of circulating tumor cells (CTCs) per mL blood in orthotopically injected mice after 4 weeks (n = 3). o) Percentage of clustering of CTCs in mouse blood at 4 weeks (n = 3). p) Relative trans-endothelial migration fraction of MDA-MB-231 subpopulations (n = 3). q) Representative images of ex vivo lung decellularization colonization assay for MDA-MB-231 subpopulations imaged 9 d post-seeding using confocal reflectance and immunofluorescence; GFP-tagged cells: green, nuclei: blue, extracellular matrix: white; Scale bars: 50 μm. r) Quantification of colonization index in ex vivo lung tissue at 9 d post-seeding (n = 50). Data in (a), (b), (f), (g), (i), (m), (n), (p) and (r) display mean ± SEM. Statistical significance in (a) was calculated using multiple t-tests. Statistical significance in (b), (f), (g), (m), (n), (p) and (r) were calculated using unpaired, two-tailed Student t-tests. Statistical significance in (i) was calculated using a Mann-Whitney test. * p < 0.05, ** p < 0.01., **** p < 0.0001, n.s., non-significant.

