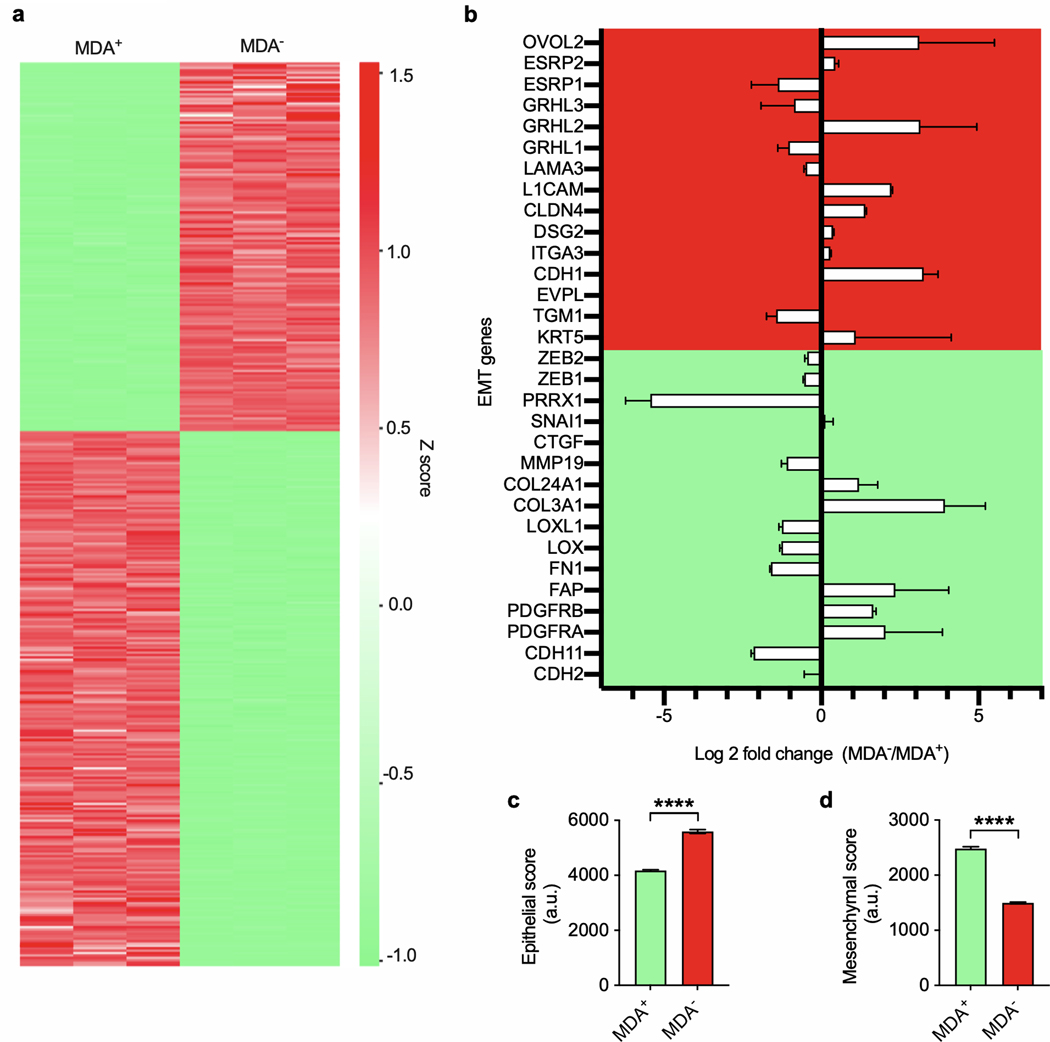
Figure 3.
RNA sequencing reveals differential EMT gene regulation in phenotypically sorted subpopulations. a) RNAseq Z score heatmap showing differential gene regulation of MDA+ and MDA− subpopulations (n = 3). b) Log 2 fold change of MDA−/MDA+ epithelial-to-mesenchymal transition genes (n = 3). c) Epithelial and d) mesenchymal scores for MDA+ and MDA− subpopulations (n = 3). Data in (b), (c), and (d) display mean ± SEM. Statistical significance in (c) and (d) was calculated using unpaired, two-tailed Student t-tests. **** p < 0.0001.

