Figure 4.
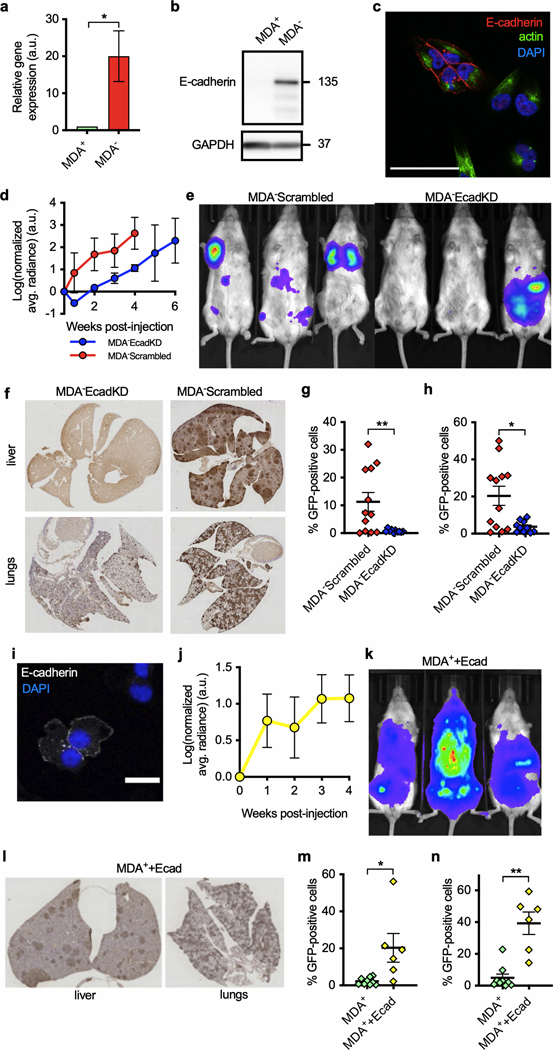
E-cadherin expression is necessary for metastasis in phenotypically sorted subpopulations. a) qPCR of E-cadherin in MDA-MB-231 subpopulations normalized to MDA+ cells (n = 3). b) Western blot of E-cadherin and GAPDH in subpopulations. c) Immunofluorescence staining of E-cadherin expression in MDA− cells. Scale bar: 25 μm. d) Primary tumor growth of MDA− E-cadherin knockdown and scrambled control tumors monitored via bioluminescence imaging (BLI) (n = 3). e) End point BLI of scrambled and E-cadherin knockdown mice at 4 weeks post tumor removal. f) Representative images of lung and liver histological sections stained with anti-GFP IHC. Quantification of percentage of GFP-positive cells in g) liver (n = 10,12) and h) lung (n = 10,12) histological sections. i) Immunofluorescence staining of E-cadherin expression in MDA+ + E-cadherin cells. Scale bar: 20 μm. j) Primary tumor growth of MDA+ + E-cadherin tumors monitored via BLI (n = 6). k) End point BLI of MDA+ + E-cadherin mice at 4 weeks post tumor removal l) Representative image of lungs and livers histological sections stained with anti-GFP IHC. Quantification of percentage of GFP-positive cells in m) liver (n = 6,9) and n) lung (n = 6,9) IHC-stained tissue sections. Data in (a), (d), (g), (h), (j), (m), and (n) display mean ± SEM. Statistical significance for (a), (g), and (h) was calculated using an unpaired, two-tailed Student’s t-test. Statistical significance for (m) and (n) was calculated using a Mann-Whitney test. *p < 0.05, **p < 0.01.

