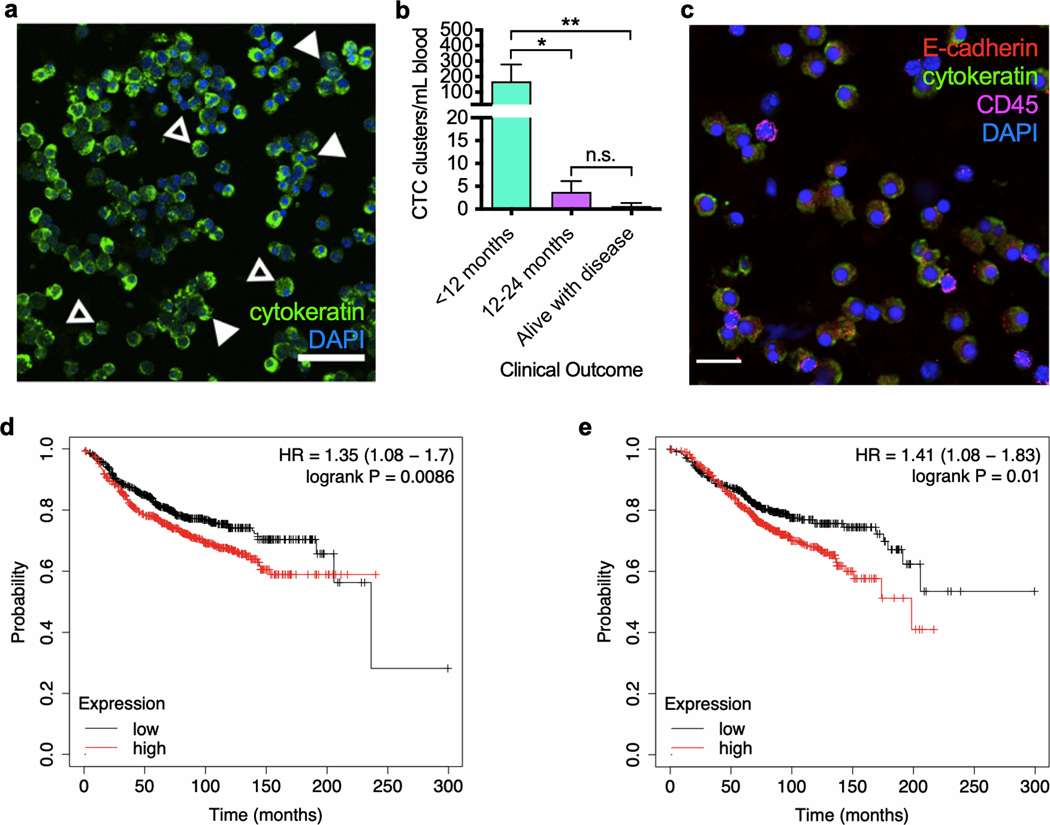
Figure 7.
Circulating tumor cell clusters and E-cadherin expression trend with worsened patient outcome. a) Representative image of circulating tumor cells (CTCs) from human cancer patient blood stained for cytokeratin (green) and DAPI (blue); filled arrows denote CTC clusters while empty arrows denote single CTCs. Scale bar: 50 μm. b) Quantification of CTC cluster concentration from blood isolated from 11 metastatic cancer patients binned by patient survival time. c) Representative image of CTCs isolated from metastatic breast cancer patient blood with E-cadherin (red), cytokeratin (green), CD45 (magenta), and DAPI (blue) staining. Scale bar: 20 μm. Kaplan-Meier curve depicting d) distal metastasis free survival (DMFS) and e) overall survival (OS) of upper and lower terciles of breast cancer patients divided by E-cadherin mRNA expression in the primary tumor. n = 1803 for (d) and n = 1402 for (e). Data in (b) display mean ± SEM. Significance was determined by a Kruskall-Wallis H test for (b). * p < 0.05, ** p < 0.01, n.s. non-significant.

