
Fig 3: CN small cells show superior intensity coding at high sound levels.
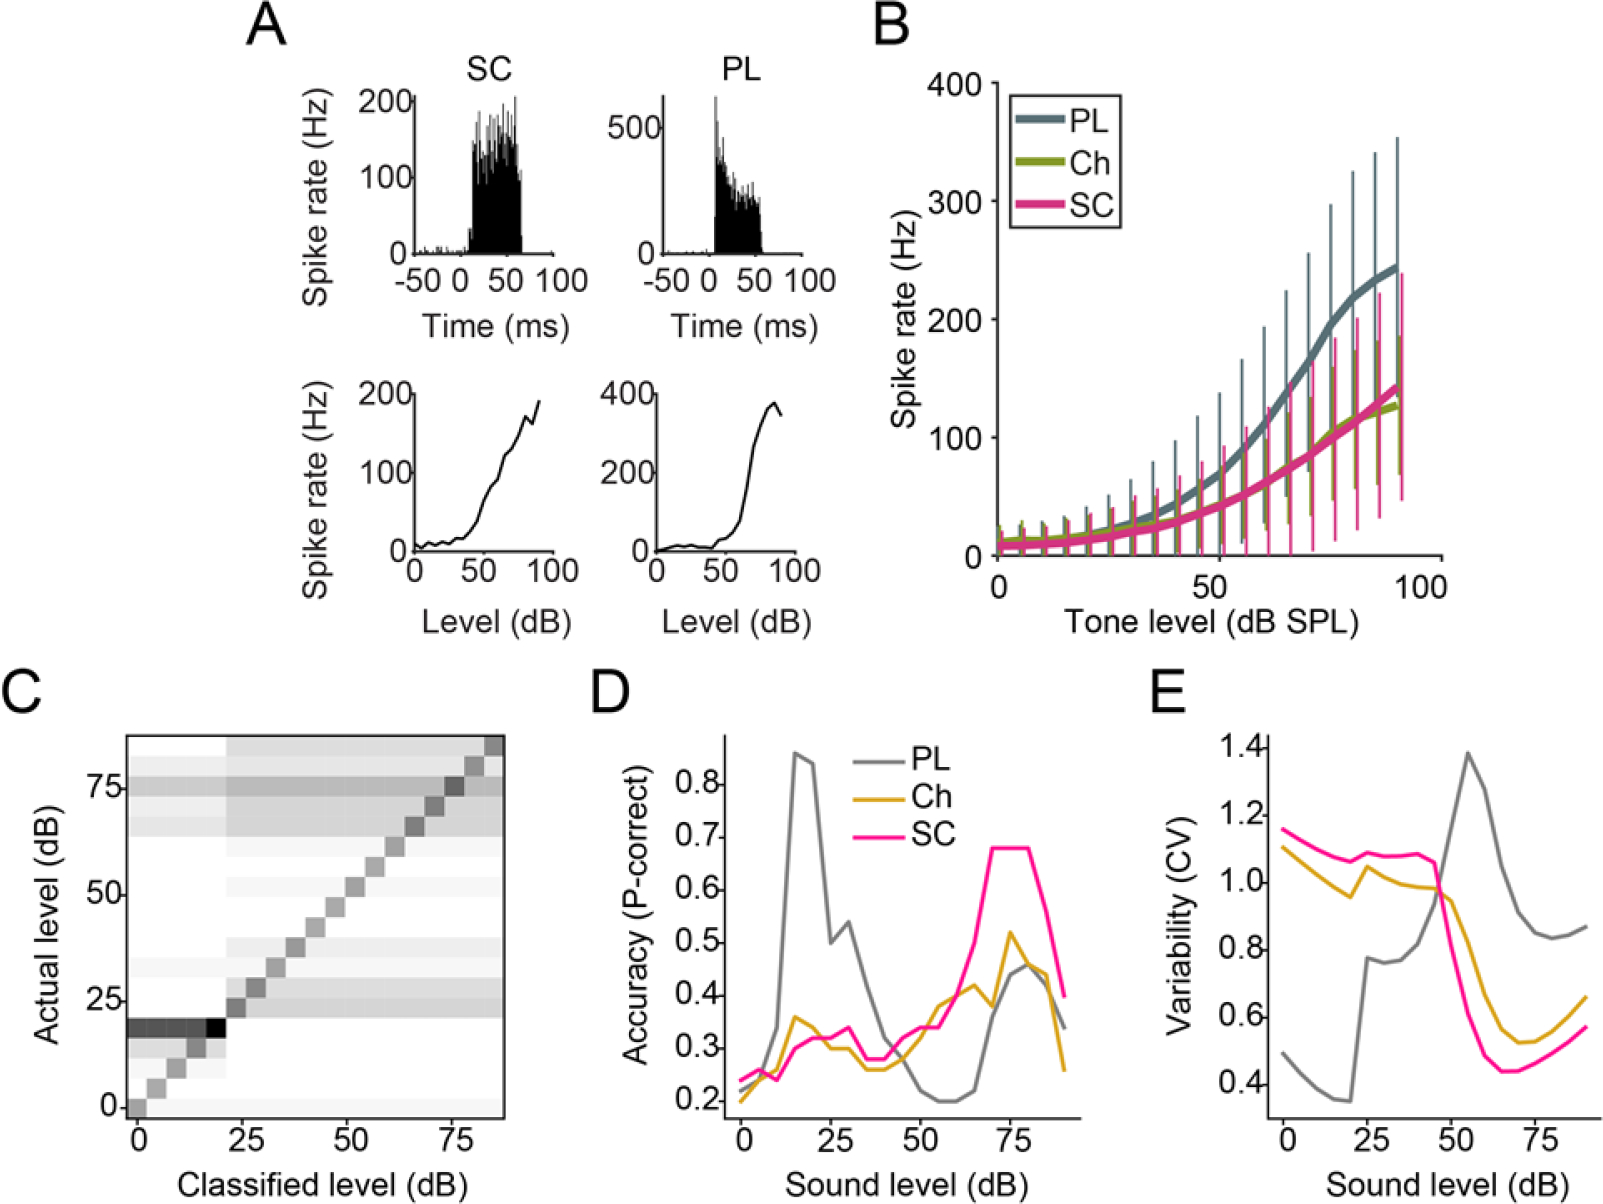
A) Example PSTH and RLFs for a CN small cell and a primary-like unit. B) Mean (± SD) RLFs of 3 major CN cell types. C) Confusion matrix for sound intensity classification across the population (all cell types). Greyscale – white pixels: 0%, black pixels: 100%. D) Probability of correct classification across unit-types. E) Trial to trial variability (coefficient of variation) of classifier performance across unit-types. SC n = 303; PL n = 708; Ch n = 243.