Figure 3.
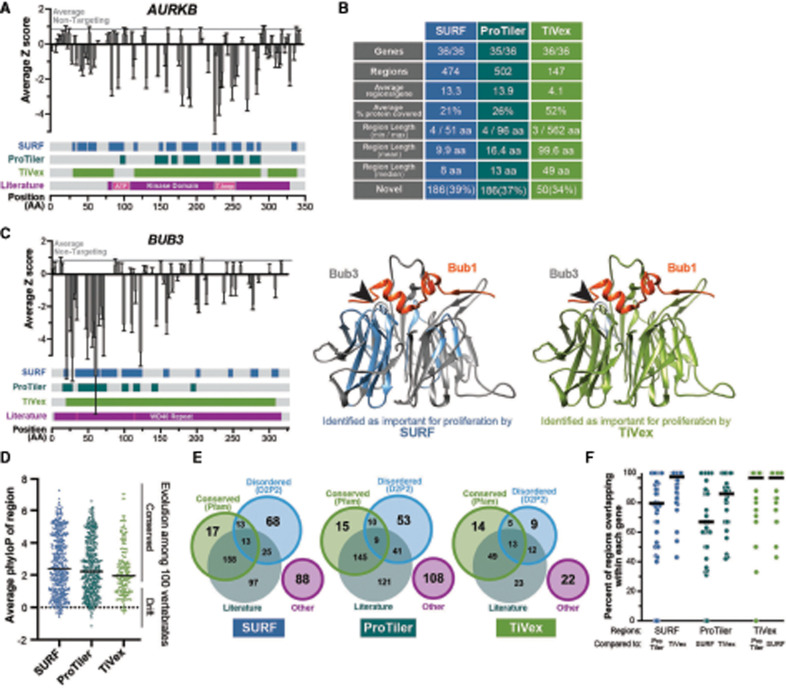
CRISPR/Cas9 tiling data identify previously known and uncharacterized functional regions, including evolutionarily divergent and disordered ones. (A) Median Z-score from four cell lines for each sgRNA is mapped to where it targets the CDS of AURKB (gray vertical bars with 95% confidence interval). Amino acid regions identified by SURF, ProTiler, or TiVex as important for cell proliferation are shown as colored in each track corresponding to coordinates at the bottom. AURKB functional regions identified in literature are shown in a similar manner; the small pink region in the kinase domain highlights the nucleotide binding pocket and activation loop. The gray horizonal line shows the average value of all nontargeting controls, representing normal levels of proliferation. (B) Table describing the characteristics of essential regions identified by analyzing tiling data with SURF, ProTiler, or TiVex in the 36 target genes previously identified (Fig. 2C). (C) Sequence-level tiling profile of human Bub3 as in A and crystal structures of budding yeast Bub3 bound to a peptide of yeast Bub1 (PDB: 2I3S) are colored based on the homologous regions identified by TiVex (green) and SURF (blue) as important for proliferation (Larsen et al. 2007). The arrowheads highlight two tryptophan residues absolutely required for the protein–protein interaction. (D) PhyloP values (based on the alignment of 100 vertebrate orthologs) for each nucleotide within SURF, ProTiler, or TiVex regions were averaged. Bars represent the median, each dot is a region, and “conserved” corresponds to a value of P < 0.05. (E) Regions identified by SURF, ProTiler, and TiVex as required for proliferation are grouped by their overlap with conserved Pfam domains (Mistry et al. 2013; El-Gebali et al. 2019), functional regions identified in the literature, or predicted disordered domains (Oates et al. 2013). Regions not fitting these categories are grouped as “other” and represent most uncharacterized regions. (F) Pairwise analysis of overlap between regions identified by each method. The graph displays the number of SURF regions within a single gene (left two columns, blue) that overlap by at least one amino acid with ProTiler or TiVex.

