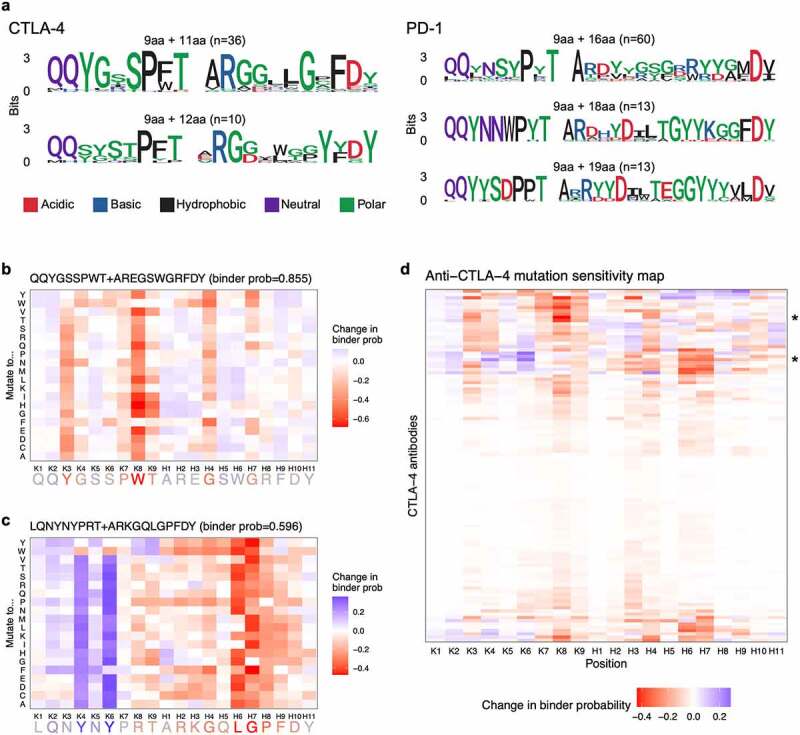
Figure 3.
(a) Figures showing amino acids present across CDR3K + CDR3H peptides for the most representative binder sequences for CTLA-4 and PD-1. CDR3K amino acids are generally shared across peptides whereas CDR3H sequences have many more variable amino acids. (b) Heatmap showing in silico showing change in predicted binder probability, relative to the original sequence’s binder probability, when an example CDR3K + CDR3H sequence is mutated to all possible amino acids. The figure shows a mix of mutation probabilities, with five amino acid positions particularly disruptive to binding when mutated. (c) Heatmap showing in silico showing change in predicted binder probability, relative to the original sequence’s binder probability, when an example CDR3K + CDR3H sequence is mutated to all possible amino acids. The figure shows a mix of mutation probabilities, with two amino acid positions particularly disruptive to binding when mutated and two amino acid positions particularly beneficial to binding when mutated. (d) Heatmap showing mutation sensitivity for a total of 108 anti-CTLA-4 antibody sequences (9 CDR3K residues + 11 CDR3H residues). The heatmap shows a mix of mutation probabilities, with no particular pattern across the residues or sequences.
CNN model interpretability and in silico mutagenesis. (a) CDR3K + CDR3H sequence logos for the most representative binder sequences (predicted binder probability ≥ 0.95) for CTLA-4 (left) and PD-1 (right). (b, c) In silico mutagenesis analysis on representative anti-CTLA-4 CDR3K + CDR3H sequences. The heatmap shows the change in predicted binder probability, relative to the original sequence’s binder probability, when the sequence (x-axis) is mutated to all possible amino acids (y-axis). The original sequence shown on the x-axis is colored by the average change in predicted binder probability across all amino acids (red = residues whose mutations resulted in decreased binder probability; blue = residues whose mutations resulted in increased binder probability). (d) Mutation sensitivity map for anti-CTLA-4 sequences (9 CDR3K residues + 11 CDR3H residues). The y-axis represents 108 sequences while the x-axis shows the positions along the sequence. The color of the heatmap shows the average (across 20 amino acids) change in predicted binder probability when a given sequence is mutated at a given position. Red indicates amino acid residues important for binder classification. *, indicate the sequences shown in b and c.

