. 2022 Apr 28;14(1):2069075. doi: 10.1080/19420862.2022.2069075

Figure 5.

(a) A series of histograms showing CDR3H amino acid length distribution for real and generated anti-CTLA-4 sequences. CDR3H lengths are similar between real and generated anti-CTLA-4 sequences. (b) A series of histograms showing CDR3H amino acid length distribution for real and generated anti-PD-1 sequences. CDR3H lengths are similar between real and generated anti-PD-1 sequences. (c) Sequence logos for real and generated CDR3s for anti-CTLA-4 sequences. Real and generated sequences have similar amino acid content. (d) Sequence logos for real and generated CDR3s for anti-PD-1 sequences. Real and generated sequences have similar amino acid content.

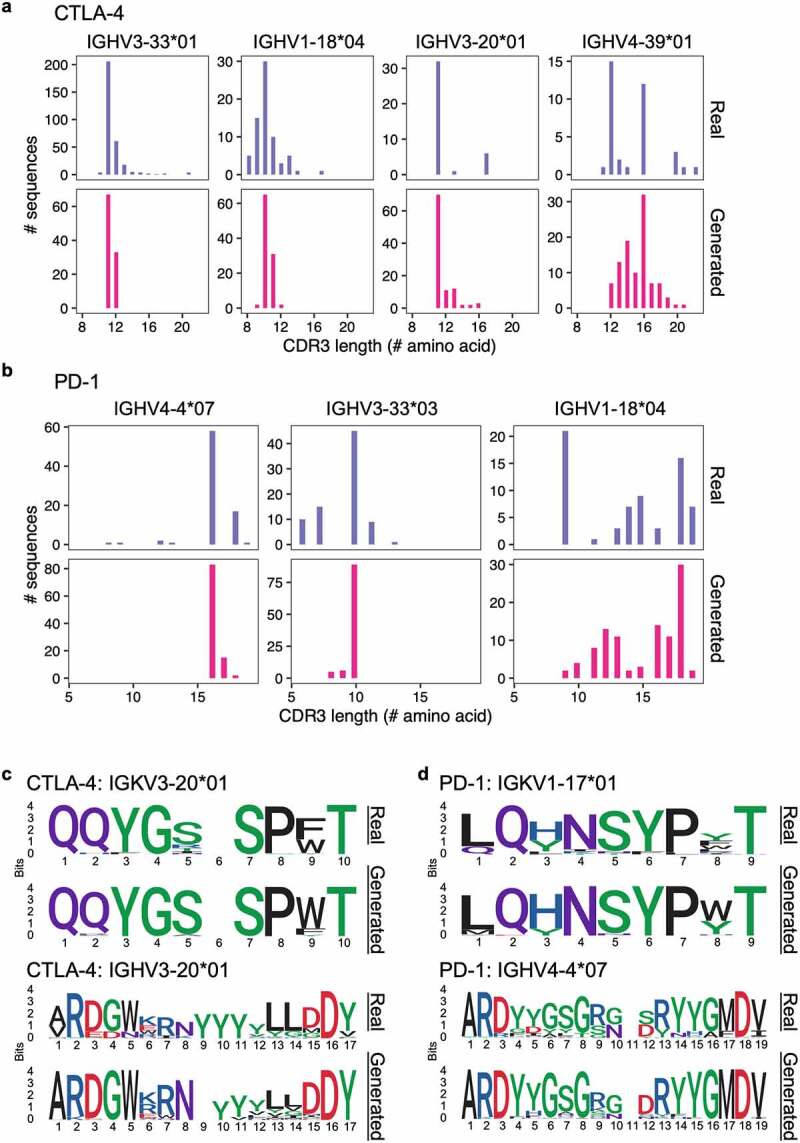
Comparing real and GAN-generated CDR3 sequences. (a, b) Histograms showing CDR3H amino acid length distribution for anti-CTLA-4 (a) and anti-PD-1 (b) sequences. Top panel show real sequences and bottom panel show GAN-generated sequences. (c, d) Sequence logos for real (top) and GAN-generated (bottom) CDR3s for anti-CTLA-4 (c) and anti-PD-1 (d) sequences with the specified V genes. Sequence logos for all models are in Figures S9 and S10.