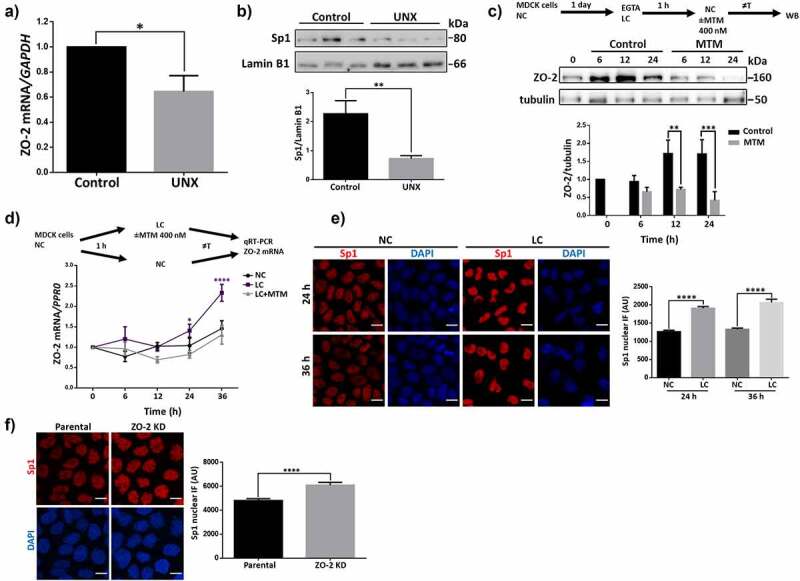
Figure 2.

Sp1 transcription factor regulates the expression of ZO-2 protein and mRNA. A) qRT-PCR amplification of ZO-2 from the kidney of sham-operated (control) rats or that had undergone a UNX 3 weeks ago. Control data normalized to 1. Statistical analysis was done with Student’s t-test, *p < .05. Results are mean ± SEM from at least three independent experiments. Glyceraldehyde-3-phosphate dehydrogenase (GAPDH) was amplified as a control. B) Western blot of Sp1 present in nuclear fractions derived from the kidney of sham-operated (control) rats or with a UNX done three weeks before. Lamin B1 was employed as a loading control. Upper panel, representative images of three independent experiments; lower panel, densitometric analysis. Results are mean ± SEM from at least three independent experiments. Statistical analysis done with Student’s t-test, **p = .0074. C) The increase in ZO-2 protein observed after MDCK monolayers are switched from LC media containing 2 mM EGTA to NC media, to induce TJ proteins synthesis and assembly, was not present in monolayers incubated with 400 nM MTM. Upper panel, a scheme of the experimental procedure and representative Western blot of three independent experiments; lower panel, densitometric analysis. Results are mean ± SEM. Control value at time 0 normalized to 1. Statistical analysis was done with Two-way ANOVA followed by Fisher’s LSD test, **p < .01, ***p < .001. D) In monolayers transferred to LC, the amount of ZO-2 mRNA increases through a process mediated by MTM. Upper panel, the scheme of the experimental procedure. Lower panel, amount of ZO-2 mRNA was determined by RT-qPCR. PRP0 mRNA was used as control. Data were normalized against NC values at time 0. Results are presented as mean ± SEM from at least three independent experiments. Values at time 0 normalized to 1. Statistical analysis was done with Two-way ANOVA followed by Tukey’s multiple comparisons post-hoc test, *p < .05, ****p < .0001. E) Immunofluorescence detection of Sp1 in the nuclei of parental MDCK cells after 24 h of incubation in NC or LC condition. Nuclei were stained with DAPI. Bar, 10 μm. Left panel, representative images; right panel, quantitation of immunofluorescence for Sp1 at the nuclei. The nuclei of 190 cells per condition derived from three independent experiments were quantitated. Statistical analysis was done with Kruskal-Wallis test followed by Dunn’s multiple comparisons test, ****p < .0001. F) Immunofluorescence detection of Sp1 in the nuclei of parental and ZO-2 KD MDCK cells. Nuclei were stained with DAPI. Bar, 10 μm. Left panel, representative images; right panel, quantitation of immunofluorescence for Sp1 at the nuclei. The nuclei of 100 cells per condition derived from three independent experiments were quantitated. Statistical analysis was done with Mann Whitney test, ****p < .0001.
