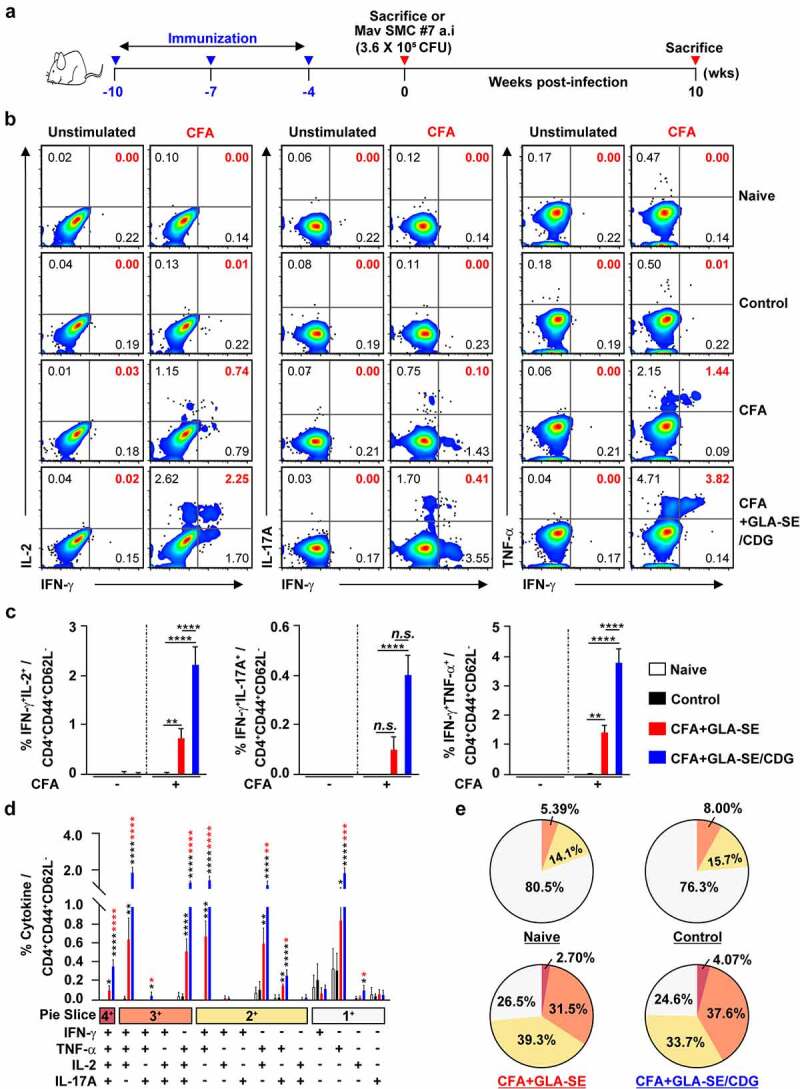
Figure 1.

Qualitative and quantitative analyses of Mav CFA-specific multifunctional CD4+ T cells in the lung after CFA+GLA-SE or CFA+GLA-SE/CDG immunization. Four weeks after the last immunization, mice were sacrificed, and lung single cells harvested from each group (n = 4) were stimulated by GolgiPlug and GolgiStop with or without 10 µg/ml CFA at 37°C for 9 h. (a) Scheme of the in vivo experiment for immunogenicity and vaccine efficacy analysis. The frequencies of Mav CFA-specific IFN-γ+IL-2+-, IFN-γ+IL-17A+- and IFN-γ+TNF-α+-expressing CD4+CD44+CD62L− T cells were assessed after staining of intracellular cytokines and are presented as (b) pseudocolor dot plots and (c) summary bar graphs. (d) The percentages of total CD4+CD44+CD62L− T cells with differential production of IFN-γ, IL-2, IL-17A and TNF-α in response to CFA stimulation among lung single cells were determined among groups and are presented as bar graphs. (e) The values of the proportions of quadruple- (4+, crimson), triple- (3+, orange), double- (2+, yellow), and single-function (1+, light gray) CD4+CD44+CD62L− T cells expressing IFN-γ, IL-2, IL-17A and TNF-α in each immunized group are illustrated as pie charts. Statistically significant differences among all groups in (c) and (d) were determined by one-way ANOVA with Tukey’s multiple comparison test, and the results are presented as the mean values along with the S.Ds. *p < .05, **p < .01, ***p < .001, ****p < .0001 and n.s.: not significant. The asterisks in (d) represent significant differences between groups: black, control group vs. CFA+GLA-SE/CDG group; red, CFA+GLA-SE group vs. CFA+GLA-SE/CDG group. The representative results are shown from a single in vivo experiment. CFA, culture filtrate antigen; Control, GLA-SE immunization alone; GLA-SE, glucopyranosyl lipid A adjuvant formulated in a stable oil-in-water emulsion; GLA-SE/CDG, GLA-SE plus cyclic-di-GMP.
