
Figure 5.
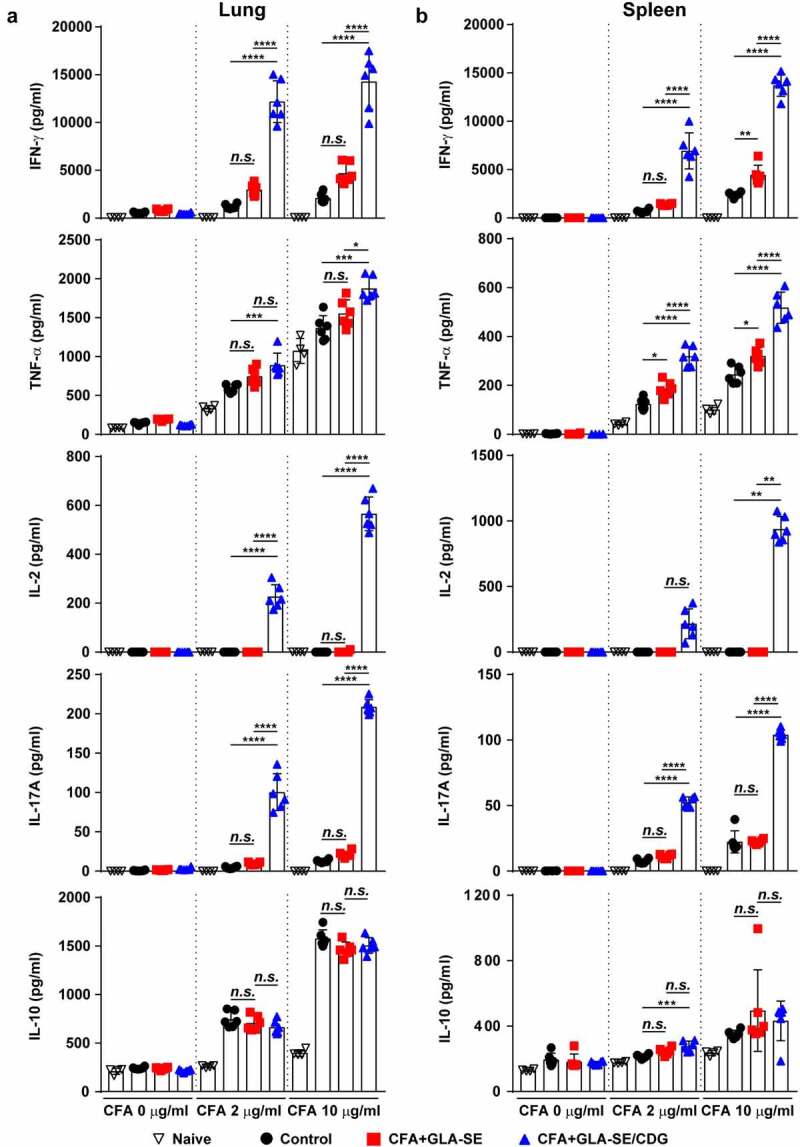
Cytokine profiles of lung and spleen single cells of mice with chronically progressive Mav-PI after ex vivo stimulation with CFA at 10 weeks post-infection. At 10 weeks post-infection, mice were sacrificed, and (a) lung single cells and (b) spleen single cells harvested from each immunized group (n = 6) and naïve group (n = 4) were stimulated with CFA (0, 2, or 10 µg/ml) at 37°C for 12 h. Secreted cytokines in the collected supernatants were quantified by ELISA, and the data are represented as a scatter plot with bars. Statistically significant differences among all groups in (a) and (b) were determined by one-way ANOVA with Tukey’s multiple comparison test, and the results are presented as the mean values along with the S.Ds. *p <.05, **p <.01, ***p <.001, ****p <.0001 and n.s.: not significant. The representative results are shown from a single in vivo experiment. CFA, culture filtrate antigen; control, GLA-SE immunization alone; GLA-SE, glucopyranosyl lipid a adjuvant formulated in a stable oil-in-water emulsion; GLA-SE/CDG, GLA-SE plus cyclic-di-GMP.