
Figure 2.
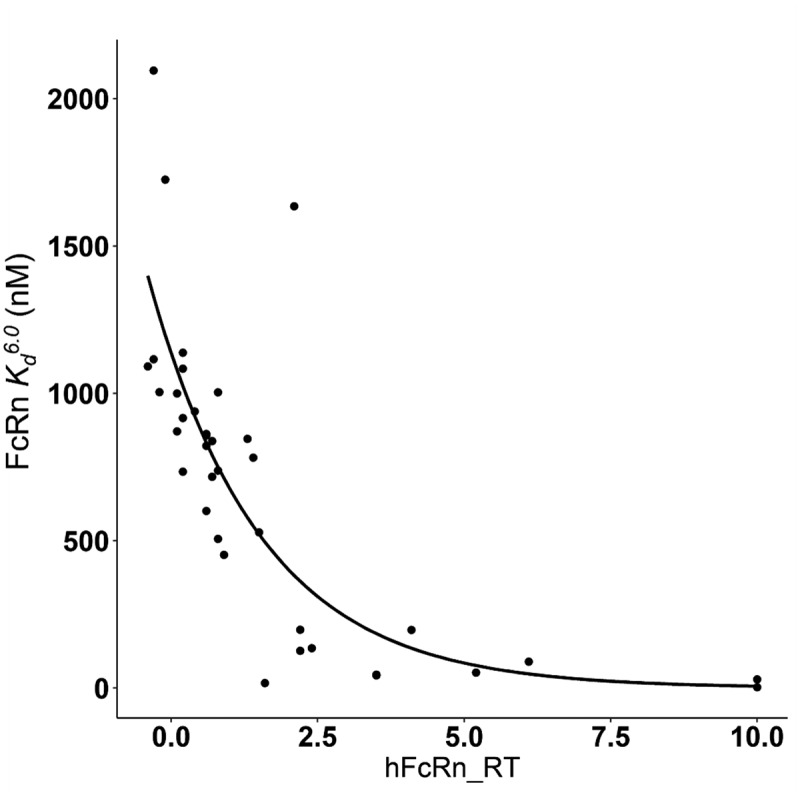
Observed and modeled relationship between FcRn and FcRn relative retention time (hFcRn_RT). The dots represent available assay results of 37 antibodies.5 The line indicates the nonlinear regression relationship: , R = 0.79.
ALT Text: A scatter plot with 37 points and a decaying fitting curve. Most points locate around the curve with four points away from it. The x axis is labeled with hFcRn_RT with a range of 0.0 to 10.0. The y axis has a title of “FcRn Kd6.0 (nM)” ranging from 0 to 2000.