Figure 3.

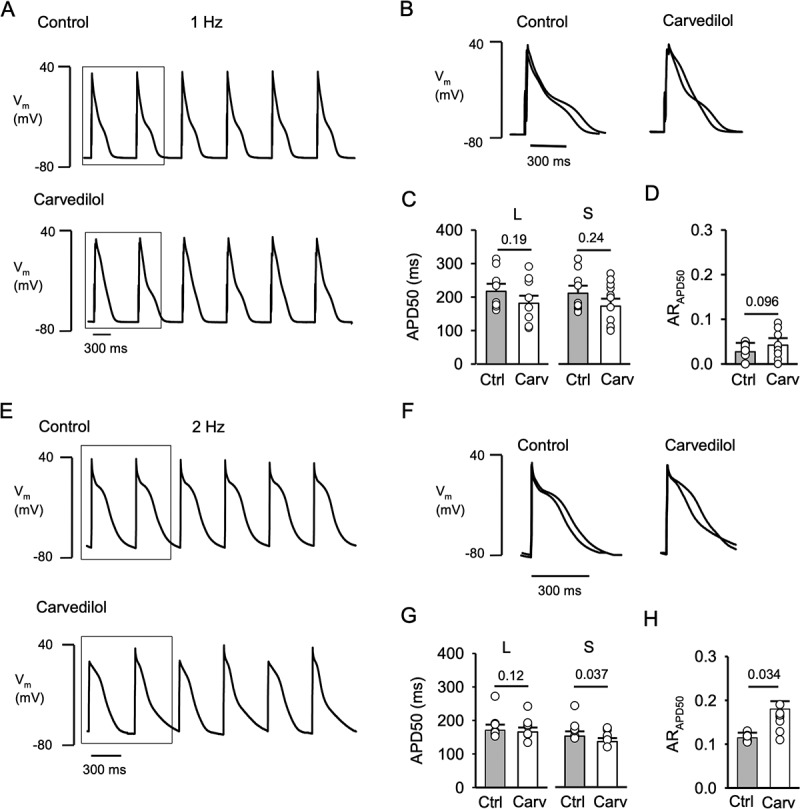
Carvedilol induces APD alternans. A, Representative AP traces recorded in control and in presence of carvedilol (0.75 µM) at 1 Hz. B, Overlay of 2 consecutive APs in control and carvedilol treated cells (marked by box in panel A). APs were recorded in current-clamp mode and evoked by 5 ms stimulation pulses of a magnitude ~1.5 times higher than AP activation threshold. C, APD of a pair of consecutive APs were classified as long (l) and short (s) based on APD50 analysis. Comparison of control and carvedilol mean APD50 of long (L: P = 0.19; n = 11) and short (S: P = 0.24) APs. D, ARAPD50 in control and after carvedilol (P = 0.096). E, Representative AP traces recorded in control and in presence of carvedilol (0.75 µM) at 2 Hz. F, Overlay of 2 consecutive APs in control and carvedilol treated cells (marked by box in panel E). G, Comparison of control and carvedilol mean APD50 of long (L: P = 0.12; n = 9) and short (S: P = 0.037) APs. H, Average ARAPD50 in control and after carvedilol treatment (P = 0.034). Statistical analysis with paired t-test.
